

A standardized extract meets its specification batch after batch, and each purification step trades recovery for purity
How the main purification operations separate constituents, the equations that size them, how European regulators define standardized and quantified extracts, and how lots are blended to a marker range.
Status. EUTECNIQ has no laboratory, columns, resins, membranes or batch data. Calculators are educational simulations with stated inputs; published results belong to the studies cited.
Hou et al., Molecules 2019; Chen et al., RSC Adv 2020; peak overlap computed from the resolution equation (Harvey, Analytical Chemistry 2.1).
Purity, recovery and batch consistency are three different targets, and a purification process has to be judged on all three
Data table (g per 100 g flavonoids fed)
| Flow | Flavonoids | Other solids | Total |
|---|---|---|---|
| Feed | 100.0 | 723.7 | 823.7 |
| Product (57.82%) | 84.9 | 62.0 | 146.9 |
| Removed (effluent and washes) | 15.1 | 661.8 | 676.8 |
Any purification yield, purity or capacity of its own; that a calculator here predicts a real column; or that an enriched fraction has the same legal status as the native extract.
Text version: who would do what
- Choose purification steps from mass balances and resolution, not from habit
- Write specifications with ranges, markers and fingerprints
- Plan blends from lot assays and document each decision
- Develop and validate the methods that release each lot
- Run pilot and commercial resin, membrane and preparative chromatography trains until EUTECNIQ's own exist
- Supply certified reference materials and accredited testing
- Advise on regulatory status of enriched fractions
- Any purification yield, purity or capacity of its own
- That a calculator here predicts a real column
- That an enriched fraction has the same legal status as the native extract
- Extraction or step yield≠purity of the product
- A marker inside its limits≠batch-to-batch uniformity of the whole extract
- A high fingerprint similarity score≠chemical equivalence
- An enriched fraction≠the same ingredient as the native extract
- Laboratory feasibility≠commercial demonstration
Explanation, details and sources
Raising the marker content usually discards some of the marker with the impurities: a resin step that lifts total flavonoids from 12% to 58% can still lose 15% of them. Standardization then holds the result lot after lot, with methods and reference materials that can prove it.
Related: Extraction (purification families), Analytical characterization and Analytical method development.
Five operations do most botanical purification, and each separates by a different property and fails in a different way
Text version: the five operations and three published examples
| Operation | Separates by | Operating principle | Typical place in a botanical train | Main limits |
|---|---|---|---|---|
| Liquid–liquid partition; countercurrent and centrifugal partition chromatography | Distribution ratio D between two immiscible liquids | Each compound divides between the phases in a fixed ratio; repeated contacts multiply small differences. CCC and CPC hold one liquid stationary without a solid support. | Defatting, removing chlorophyll or sugars, fractionating by polarity | Solvent volumes and residual solvents (see ICH Q3C on the extraction page); emulsions with saponin-rich extracts |
| Macroporous adsorbent resins | Adsorption strength on a non-ionic polymer surface | Load an aqueous extract, wash away sugars and salts with water, elute the retained fraction with aqueous ethanol. Capacity follows an isotherm such as Langmuir's. | Enriching flavonoids, saponins, alkaloids from crude aqueous extracts | Breakthrough when capacity is used up; co-adsorption of similar compounds; resin ageing over cycles |
| Flash and preparative HPLC | Retention on silica or bonded phases | Same physics as analytical chromatography at higher load; resolution follows plate number, selectivity and retention. | Isolating single constituents, reference materials, high-purity fractions | Solvent and media cost per kilogram; at preparative loads the separation is governed by nonlinear isotherms, which call for nonlinear, non-ideal chromatography models (Guiochon 2002) |
| Membranes (ultrafiltration, nanofiltration, diafiltration) | Molecular size and charge relative to the membrane cut-off | Pressure drives solvent and small solutes through; rejected solutes stay in the retentate. Diafiltration washes permeable solutes out with added solvent. | Removing salts and sugars, concentrating at low temperature, solvent exchange | Fouling; incomplete rejection loses product with every diavolume |
| Crystallization | Fit into a crystal lattice | Supersaturation (by cooling, antisolvent or evaporation) drives a compound out of solution as crystals that tend to exclude dissimilar molecules. | Final step for single, well-defined constituents | Impurities enter by agglomeration, surface deposition, inclusions, cocrystals or solid solutions (Urwin et al. 2020); rarely applicable to whole extracts |
Total flavonoids rose from 12.14% to 57.82% on AB-8 resin, with 84.93% recovery
Hou and colleagues loaded a Sophora tonkinensis extract at 2 bed volumes per hour (breakthrough volume 16 BV) and desorbed with 9 BV of 60% aqueous ethanol. The 4.76-fold enrichment cost about 15% of the flavonoids.
Peer-reviewedHou M, et al. Molecules. 2019;24(17):3200.
Alkaloid content rose 4.41-fold after a 10-fold scale-up on XR918C resin, with 89.19% recovery
Fu and colleagues set loading at 2 BV/h and 7 BV, where the outlet reached one tenth of the feed concentration, and eluted with 80% ethanol. The resin performed consistently over nine regeneration cycles.
Peer-reviewedFu R, et al. Foods. 2026;15(6):1054.
At 95% rejection, ten diavolumes wash out about 40% of the product
A review of organic-solvent nanofiltration in pharmaceutical work shows why rejection close to 100% matters: every diavolume removes the fraction 1 − R of what remains. The washout relation below reproduces the 40% figure (computed 39%).
Peer-reviewedXiao H, et al. Org Process Res Dev. 2024;28(4):891–923 (open access).
Explanation, details and sources
Partition separates by how a compound divides between two liquids, adsorption by how strongly it sticks, membranes by size, and crystallization by fit into a lattice. A train usually combines two or three.
Partition, adsorption capacity, breakthrough and chromatographic resolution are the four relations that size most purification steps
Each relation is quoted from the source under it. They are idealizations; real extracts add competition between compounds, nonlinear isotherms and fouling.
Rejection definition and example: Xiao H, et al. Org Process Res Dev. 2024. Derivation: computed
Text version: symbols, notes and the diafiltration table
Partition and repeated extraction. The extraction factor E is the same equation with numerator and denominator divided by Vaq. With D = 2 and equal volumes (E = 2), one extraction leaves 33% behind; three extractions with a third of the solvent each leave 22%. Several small extractions beat one large one.
Adsorption capacity. qe: amount adsorbed per gram of resin at equilibrium (mg/g); Ce: equilibrium concentration (mg/mL); qm: monolayer capacity; KL: Langmuir constant. Capacity saturates, so overloading a column wastes feed.
Breakthrough of a packed bed. kTh: rate constant (mL mg⁻¹ min⁻¹); Q: flow (mL/min); q0: capacity (mg/g); m: resin mass (g). The Bohart–Adams and Yoon–Nelson models are mathematically equivalent forms of the same logistic curve, so fitting all three to one data set does not compare three mechanisms.
Chromatographic resolution. w: baseline width (4σ for a Gaussian); N: plate number; α = kB/kA: selectivity; k: retention factor. Selectivity moves resolution most; above kB ≈ 10 more retention buys little. At Rs = 1.5, equal-area peaks overlap by only 0.13%.
Diafiltration washout. Derived here from a solute balance on a well-mixed retentate (ND: diavolumes; Cp, Cr: permeate and retentate concentrations). It reproduces the review's example: R = 0.95 and 10 diavolumes leave e−0.5 = 61% (39% lost).
| Rejection R | 3 diavolumes | 5 diavolumes | 10 diavolumes |
|---|---|---|---|
| 0.50 (a sugar to be removed) | 22% | 8.2% | 0.67% |
| 0.80 | 55% | 37% | 14% |
| 0.95 | 86% | 78% | 61% |
| 0.99 (a product to be kept) | 97% | 95% | 90% |
Rejection depends on the membrane, solute, pressure and fouling; these rows are arithmetic, not membrane data.
Explanation, details and sources
(Qaq)n = (VaqD Vorg + Vaq)n
E = D VorgVaq ⇒ (Qaq)n = (1 + E)−n
Harvey D. Analytical Chemistry 2.1, section 7.7, eqs 7.1, 7.6, 7.7 (LibreTexts, open textbook).
Langmuir I. J Am Chem Soc. 1918;40:1361–1403; linear form as used by Hou et al. 2019, eq 4.
Aranda-García E, Cristiani-Urbina E. PLoS One. 2020;15(1):e0227953, eq 5; Juela DM. Materials. 2021;14(4):848.
Harvey D. Analytical Chemistry 2.1, eqs 12.1 and 12.3 (LibreTexts); Purnell JH. J Chem Soc. 1960:1268–1274. USP ⟨621⟩ (harmonized, official December 1, 2022) uses 1.18(tR2 − tR1)/(Wh1 + Wh2) with half-height widths.
When two peaks overlap, each extra point of purity costs recovery, and the cost rises steeply near the limit
recovery = fT purity = fTfT + ρ fI
- Linear (analytical-scale) loading, so peaks stay Gaussian
- Equal detector response per unit mass, so areas are masses
- Only one impurity; real extracts have many
Drag to rotate, or use the buttons. Each point on the surface is one cut window (start, end). Windows that end before they start collect nothing and lie flat at zero.
At the default settings the best window meeting 98.0% purity runs about 11.43–14.48 min and recovers about 97.1% of the target; the default window (11.80–14.00 min) recovers 74.8%.
Method, assumptions and limits
- What it calculates
- For a target peak (12.00 min) and one impurity peak, the fraction of each collected between cut start a and cut end b, the resulting purity and recovery, the resolution, and the cut window with the highest recovery that still meets the purity specification.
- Equations
- Fraction of a Gaussian peak (center t, standard deviation σ) inside [a, b]: f = ½[erf((b − t)/(σ√2)) − erf((a − t)/(σ√2))]. Recovery = fT. Purity = fT/(fT + ρ fI), where ρ is the impurity-to-target mass ratio in the load. Rs = |Δt|/(2(σ1 + σ2)).
- Variables and units
- Times and widths in minutes; ρ dimensionless; purity and recovery in percent of mass.
- Search
- Exhaustive search over all windows with ends on a 0.01 min grid between 8 and 16 min, then each end refined on a 0.0005 min grid. Purity is the binding constraint at the optimum.
- Assumptions
- Gaussian peaks (linear isotherm); equal response factors; perfect fraction switching; no peak tailing.
- Valid range
- The slider ranges. At preparative loads the isotherm is nonlinear, peak shapes then depend on it, and this Gaussian model no longer applies (Guiochon 2002 reviews the nonlinear models).
- What it does not establish
- The purity or recovery of any real separation; the effect of other impurities; detector response factors.
- Verification
- An independent Python reference (scipy.special.erf, vectorized window search) reproduces purity, recovery and the best window in
tests/numerics/ref/technologies-purification-standardization.py.
Explanation, details and sources
A target constituent and an impurity leave a column as two Gaussian peaks. The collected fraction runs from cut start to cut end. Move the cut points and the impurity peak to see purity and recovery change; the 3D surface shows recovery for every pair of cut points, with the region that meets the purity specification shaded amber.
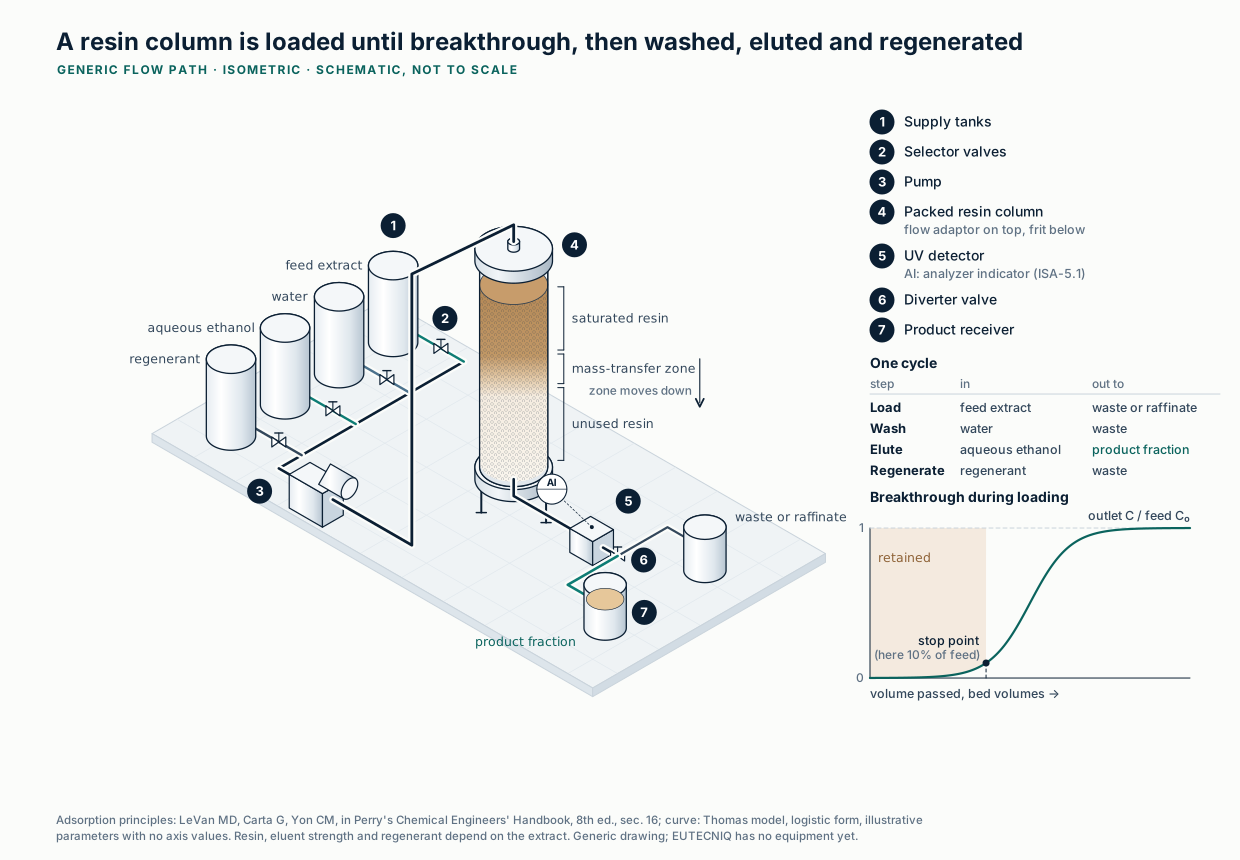
A resin column stops at breakthrough, well before its capacity is used, so flow rate and bed size set the resin a batch needs
Method, assumptions and limits
- What it calculates
- The breakthrough curve of a packed adsorbent bed, the throughput and time at which the outlet reaches the chosen fraction of the feed, the mass retained per liter of bed at that point, and the share of capacity used.
- Equations
- C/C0 = 1/(1 + ea − bV) with a = kN0/F and b = kC0/F. Stop point Vc = (a − ln(1/p − 1))/b. Retained mass per mL of bed = C0[V − ∫0V(C/C0)dV], with the integral in closed form, (ln(1 + ebV − a) − ln(1 + e−a))/b.
- Variables and units
- C0 in mg/mL; N0 in mg per mL of packed bed; k in mL mg⁻¹ h⁻¹ (0.35 ≈ 0.0059 mL mg⁻¹ min⁻¹ × 60); F in bed volumes per hour; throughput V in bed volumes.
- Assumptions
- Single solute, constant feed, plug flow, a capacity independent of flow. In real columns capacity fitted at higher flow is often lower (Fu et al. 2026 reported 50.4, 43.1 and 36.4 mg/g at 2, 3 and 4 BV/h), which this model does not capture.
- Valid range
- The slider ranges. When the outlet already exceeds the stop fraction at the start, the tool reports that the bed is overloaded.
- What it does not establish
- Resin choice, capacity or selectivity for any extract; competitive adsorption; elution recovery.
- Verification
- The Python reference finds the stop point with a root finder (scipy.optimize.brentq) and integrates the curve numerically (scipy.integrate.quad).
Data table (mg/g)
| Ce, mg/L | 25 °C | 35 °C | 45 °C |
|---|---|---|---|
| 25 | 13.83 | 12.22 | 10.87 |
| 50 | 17.64 | 15.85 | 14.32 |
| 100 | 20.45 | 18.62 | 17.01 |
| 200 | 22.22 | 20.41 | 18.78 |
| 270 | 22.73 | 20.93 | 19.30 |
| 350 | 23.08 | 21.28 | 19.66 |
Method, assumptions and limits
- What it calculates
- Equilibrium flavonoid loading on AB-8 resin at the chosen solution concentration, at three temperatures, from the published Langmuir fits.
- Equation
- qe = qmKLCe/(1 + KLCe), Ce in mg/L, q in mg per g resin.
- Valid range
- 10–350 mg/L, inside the study's 70–400 mg/L initial concentrations; one extract (Sophora tonkinensis, 70% ethanol extract) on one resin.
- What it does not establish
- Loading in a flowing column, which stops at breakthrough (16 bed volumes at 2 BV/h in the study), or the behavior of any other extract or resin.
- Verification
- Unit test in
tests/unit/purify.test.js; independent Python reference intests/numerics/ref/technologies-purification-standardization.py.
Explanation, details and sources
Feed is pumped through a resin bed until the outlet concentration reaches a set fraction of the feed. In the Thomas model the half-breakthrough point depends only on capacity and feed concentration; faster flow spreads the curve, so the stopping point comes earlier and less of the capacity is used.
European regulators recognize three kinds of extract, and only one of them is adjusted to a constituent with known therapeutic activity
Text version: the three categories, how each is adjusted and the worked examples
| Category | Adjusted to | How the adjustment is made | Example in the guideline |
|---|---|---|---|
| Standardised | "a defined content of one or more constituents with known therapeutic activity" | "adjustment of the herbal preparation with inert excipients or by blending batches of the preparation" | Horse chestnut seed dry extract: 8% triterpene glycosides expressed as protoaescigenin; 70–95% genuine extract; DERgenuine 5–8:1; ethanol 80% V/V |
| Quantified | "one or more active markers, the content of which is controlled within a limited, specified range" | "Adjustments are made by blending batches of the herbal preparation" | Ginkgo leaf dry extract, refined and quantified: 22.0–27.0% flavonoids expressed as flavone glycosides; 2.8–3.4% ginkgolides A, B and C; 2.6–3.2% bilobalide; DERgenuine 35–67:1; acetone 60% m/m |
| Other | "not adjusted to a particular content of constituents" | "one or more constituents are used as analytical markers"; their content is in the specification, not the label | Valerian root dry hydroalcoholic extract: 80% genuine extract; DERgenuine 3–6:1; ethanol 70% V/V |
European Medicines Agency. Guideline on declaration of herbal substances and herbal preparations in herbal medicinal products/traditional herbal medicinal products, EMA/HMPC/CHMP/CVMP/287539/2005 Rev. 1 (in effect since October 1, 2010); wording and examples as reproduced in the Rev. 2 draft released for consultation April 1–June 30, 2026 (status as of October 2026: draft). Rev. 1 in effect Rev. 2 draft
The DER states how much plant went into each unit of extract, and the genuine DER excludes the excipients added afterwards
More on the DER
EMA: “the ratio between the quantity of herbal substance used in the manufacture of a herbal preparation and the quantity of herbal preparation obtained”, normally a range. A 5:1 extract says how concentrated the process was, not how much active it contains.
The genuine (native) DER refers to the extract without excipients. Because plants vary, it “will normally be a range, e.g., 3.0-5.5:1”. Two 5:1 extracts made with different solvents can differ widely in composition.
EMA/HMPC/CHMP/CVMP/287539/2005, chapter 6 and Definitions.
Active markers are generally accepted to contribute to activity; analytical markers only serve analysis
More on markers
EMA's reflection paper adds a footnote that is the reason this page includes fingerprints: “the presence of the set markers within the established limits does not ensure by itself batch-to-batch uniformity.”
EMA's reflection paper defines markers as constituents “of interest for control purposes independent of whether they have any therapeutic activity”. Selection must be justified, the same marker is normally used from raw material to the end of shelf life, and the stability of the rest of the extract should be shown, for example with fingerprint chromatograms.
EMEA/HMPC/253629/2007, Reflection paper on markers used for quantitative and qualitative analysis of herbal medicinal products (adopted July 3, 2008).
A marker assay is only as accurate as the reference standard it is calibrated against
Full ICH definitions
ICH Q7: a primary standard is “authentic material that should be of high purity”; a secondary standard is calibrated against it. For botanicals the matrix also matters, so certified extract materials exist alongside pure-compound standards.
ICH Q7 defines a primary reference standard as “a substance that has been shown by an extensive set of analytical tests to be authentic material that should be of high purity”, and a secondary standard as one “of established quality and purity, as shown by comparison to a primary reference standard”. ICH Q2(R2) adds that reference materials may be pharmacopoeial, national or in-house primary or secondary materials.
ICH Q7 (Step 4, November 10, 2000), Glossary; ICH Q2(R2) (November 1, 2023), Glossary.
| Analyte | Mass fraction |
|---|---|
| Quercetin (aglycone) | 45.1 ± 4.6 mg/g |
| Kaempferol (aglycone) | 40.8 ± 3.0 mg/g |
| Isorhamnetin (aglycone) | 10.8 ± 1.3 mg/g |
| Total flavonoid aglycones | 96.8 ± 8.3 mg/g |
| Ginkgolides A, B, C (11.6, 5.92, 12.4) | 29.9 mg/g (sum, computed) |
| Bilobalide | 28.5 ± 2.1 mg/g |
| Total terpene lactones | 62.4 ± 5.7 mg/g |
| Lead | 4.273 ± 0.031 mg/kg |
Explanation, details and sources
EMA's declaration guideline, following the European Pharmacopoeia, separates standardized, quantified and other herbal preparations. The terms come from EU medicinal-product law; EUTECNIQ would use them as specification vocabulary in any market (proposal).
Blending three assayed lots can bring two markers into range at the lowest cost, and the feasible blends form a polygon in a triangle
Σ xi = 1, 0 ≤ xi ≤ si/M
L1 ≤ Σ xigi ≤ U1, L2 ≤ Σ xihi ≤ U2
| Lot | Ginkgolides A+B+C (%) | Bilobalide (%) | Price ($/kg) | Stock (kg) |
|---|---|---|---|---|
| A | ||||
| B | ||||
| C |
Method, assumptions and limits
- What it calculates
- The set of blends of three lots that meets two marker ranges and stock limits, the least-cost blend in that set, and the markers and price of a blend you choose.
- Equations
- Blend content Σxigi for each marker; price Σxici; fractions sum to 1 and lot i cannot exceed its stock si divided by batch size M. With xC = 1 − xA − xB, every constraint is a half-plane in (xA, xB); the feasible set is the triangle clipped by all of them (Sutherland–Hodgman), and a linear objective is minimized at one of its corners.
- Assumptions
- Linear mixing by mass, homogeneous lots, assay values without uncertainty, and no losses. Real decisions would use the assay uncertainty and a guard band inside each range.
- Regulatory limits
- EMA allows blending batches to adjust quantified extracts and blending or excipients for standardised ones. Blending must not be used to dilute a contaminant: FDA's food CGMP rule states that mixing a food with defects at adulterating levels with another lot "is not permitted and renders the final food adulterated" (21 CFR 117.110(b)). EUTECNIQ would blend only lots that individually meet every safety specification (proposal); how Part 117 and Part 111 apply to a given operation is a question for counsel.
- What it does not establish
- That any real lot meets a monograph; that the blend matches the reference fingerprint; stability of the blend.
- Verification
- The Python reference solves the same linear program with scipy.optimize.linprog (HiGHS) and checks the blend contents.
Explanation, details and sources
The ranges below are the ginkgolide and bilobalide ranges of the EMA's quantified ginkgo example; the lots, prices and stock are invented. With linear mixing, each marker range is a band across the triangle of blend fractions, stock limits cut off corners, and the cheapest feasible blend sits at a corner of what remains (linear programming).
A fingerprint similarity of 0.99 can hide a missing minor constituent, because large peaks dominate the score
Method, assumptions and limits
- What it calculates
- The congruence coefficient and Pearson correlation between a reference fingerprint (nine peak areas) and a test lot in which the largest peak, one minor marker, an extra peak and the overall dilution can be changed.
- Equations
- As shown; vectors include a tenth position that is zero in the reference, so an unknown peak enters the comparison.
- Assumptions
- Peaks already matched by retention time; equal weighting of peak areas; no normalization other than that inside each coefficient.
- What it shows
- Removing the minor marker entirely leaves c above 0.99; diluting every peak equally does not change c or r at all, so similarity never replaces a quantitative assay. Published alternatives discriminate better: multivariate analysis of several quality indicators (Chen et al. 2020) and statistical tests on peak-by-peak differences (Gan & Ye 2006).
- What it does not establish
- An acceptance threshold for any product; the identity of an unknown peak.
- Verification
- The Python reference recomputes both coefficients with numpy (and numpy.corrcoef).
Data table
| Compound | Before, % | After, % | Enrichment | Recovery |
|---|---|---|---|---|
| Rutin | 0.014 | 0.036 | ×2.6 | 83.47% |
| Trifolirhizin | 0.756 | 3.198 | ×4.2 | 86.51% |
| Quercitrin | 0.026 | 0.032 | ×1.2 | 84.22% |
| Quercetin | 0.007 | 0.067 | ×9.6 | 91.53% |
| Maackiain | 1.617 | 7.842 | ×4.8 | 87.16% |
| Formononetin | 0.067 | 0.842 | ×12.6 | 85.90% |
Purification changes the ratios between constituents, so an enriched fraction needs its own reference fingerprint.
Explanation, details and sources
Chromatographic fingerprints are often compared with a congruence coefficient (the cosine of the angle between two peak-area vectors) or a correlation coefficient. Both reward agreement in the biggest peaks. Chen and colleagues found HPLC-UV fingerprint similarities above 0.985 across 13 batches of an injection whose other quality indicators showed poor batch consistency.
EUTECNIQ would design the process, the specification, the methods and the release logic together, as one package
None of this exists yet; work would start at bench and pilot scale with partners.
Text version of the six steps, with links
- Characterize the crude extractMarker assays, fingerprint, contaminants (see Analytical characterization)
- Screen separationsPartition coefficients, resin isotherms, membrane rejection at bench scale
- Model and choose the trainMass balance, recovery–purity trade-off, solvent and resin use
- Write the specificationCategory, DER, marker ranges, fingerprint criteria, contaminant limits
- Validate release methodsFollowing ICH Q14 and Q2(R2) principles
- Assess regulatory statusWhether an enriched fraction is a new dietary ingredient (see NDIN); counsel decides
Quality-system context for specifications and supplier certificates is on Quality standards; process scale-up is on Process engineering.
Need an extract enriched to a specification, with the numbers to defend it?
Describe the botanical, the target constituents and the market. EUTECNIQ would respond with a proposed separation strategy and the data it would need.