EUTECNIQ Sciences

See every page on one mapArrow keys move through results · Enter opens · Esc closes

Combination science Peer-reviewed studies NIH ODS and NCCIH Illustrative models

Most measured combination effects change absorption or metabolism, and testing synergy in people needs a factorial trial

Published findings for botanical, vitamin and mineral pairs, sorted by mechanism and evidence level, and why “synergy” depends on the reference model and the trial design.

10 of 12catalogued findings concern absorption or metabolism; none tests synergy at a target
18% → 82%inhibition of iron absorption as added phytate rose from 2 to 250 mg phosphorus
29%power to detect an interaction as large as the main effect in a trial with 80% power for that effect
4×the participants needed to test that interaction with 80% power

Status. EUTECNIQ is pre-operational and has tested no combination. The catalog reports other researchers' published results. The surfaces, isobologram and sample-size calculator are educational models with stated, illustrative parameters; they are not data about any ingredient.

Academy fundamentals: Course 11, Multi-objective ingredient design

Mechanisms

Combination effects fall into five mechanisms, and only one of them is synergy at a biological target

Five mechanisms, five kinds of evidence; only the pharmacodynamic class is synergyPublished mechanisms
Five combination mechanisms, each shown by a different measurement: pharmacokinetic enhancement, metabolism inhibition or induction, pharmacodynamic interaction (the only one that synergy describes), physicochemical protection, and antagonism1PharmacokineticenhancementOne partner raises howmuch of the other isabsorbedShown byBlood or chylomicron AUCExampleFat with carotenoids;ascorbic acid with non-hemeiron2Metabolisminhibition orinductionCYP3A4blocksOne partner changes theenzymes or transportersthat clear the other, or adrugShown byProbe-drug kinetics;enzyme and transporterassaysExamplePiperine: CYP3A4, P-gp (invitro); St John's wortinduces CYP3A43Pharmacodynamicinteractionsame targetBoth act on the samepathway or complementaryonesShown byEffects vs Loewe or Bliss;in people, a factorial trialExampleThe only class that the wordsynergy describes precisely4Physicochemicalprotectionkept intactOne partner keeps theother soluble, dispersed orintactShown byDigestive-recoverymodels; absorption studiesExampleAscorbic acid with green teacatechins (rats, cells)5Antagonism andadverse interactionOne partner binds,competes with or speedsremoval of the otherShown byAbsorption anddrug-interaction studiesExamplePolyphenol beverages andcalcium cut non-heme ironuptakethe activethe partnerSchematic, not to scale. Pharmacokinetic enhancement ≠ pharmacodynamic synergy; in vitro synergy ≠ clinical synergy.Five combination mechanisms and how each is shown1 · Pharmacokinetic enhancementOne partner raises how much of the other is absorbed.Shown by: Blood or chylomicron AUC. Example: Fat withcarotenoids; ascorbic acid with non-heme iron.2 · Metabolism inhibition or inductionOne partner changes the enzymes or transporters thatclear the other, or a drug. Shown by: Probe-drugkinetics; enzyme and transporter assays. Example:Piperine: CYP3A4, P-gp (in vitro); St John's wort inducesCYP3A4.3 · Pharmacodynamic interactionBoth act on the same pathway or complementary ones.Shown by: Effects vs Loewe or Bliss; in people, afactorial trial. Example: The only class that the wordsynergy describes precisely.4 · Physicochemical protectionOne partner keeps the other soluble, dispersed or intact.Shown by: Digestive-recovery models; absorptionstudies. Example: Ascorbic acid with green tea catechins(rats, cells).5 · Antagonism and adverse interactionOne partner binds, competes with or speeds removal ofthe other. Shown by: Absorption and drug-interactionstudies. Example: Polyphenol beverages and calcium cutnon-heme iron uptake.
Examples from the evidence catalog below (PubMed, NIH ODS and NCCIH sources, opened October 22, 2026). Schematic, not to scale.
Text version of the five mechanisms
1 · Pharmacokinetic enhancement

One partner raises how much of the other is absorbed

Shown by blood or chylomicron concentrations over time (AUC). Examples below: dietary fat with carotenoids; ascorbic acid with non-heme iron.


2 · Metabolism inhibition or induction

One partner changes the enzymes or transporters that clear the other, or a drug

Shown by probe-drug kinetics in people, or by enzyme and transporter assays. It carries drug-interaction risk: piperine inhibits CYP3A4 and P-glycoprotein in vitro; St John's wort induces CYP3A4 in people.

3 · Pharmacodynamic interaction

Both act on the same pathway or on complementary ones

Shown only by effect measurements against a stated reference model (Loewe or Bliss) and, in people, by a factorial trial. This is the only class that the word synergy describes precisely.

4 · Physicochemical protection

One partner keeps the other soluble, dispersed or chemically intact

Shown by digestive-recovery models and absorption studies. Ascorbic acid with green tea catechins is an example in rats and cell models.

5 · Antagonism and adverse interaction

One partner binds, competes with or speeds the removal of the other

Polyphenol-rich beverages and calcium reduce non-heme iron absorption; enzyme induction can weaken medicines. These are as important for a formula as any gain.

What does not follow

Each step in evidence needs its own study

  • Pharmacokinetic enhancement≠Pharmacodynamic synergy
  • Bioavailability gain≠Efficacy or safety
  • In vitro synergy≠Clinical synergy
Explanation, details and sources

Each mechanism is shown by a different kind of measurement: an absorption study cannot show a combined effect on a target, and a cell assay cannot show what reaches the blood.

Evidence catalog

Ten of twelve findings concern absorption or metabolism, and the one botanical-pair efficacy trial lacked the arm needed to test synergy

Twelve findings by mechanism; ten concern absorption or metabolism, and none tests synergy at a targetPrimary studies
The twelve catalogued combination findings by mechanism: ten concern absorption or metabolism (enhancement, protection, antagonism or enzyme change), one tested a mixture without separating partners, and one botanical pair claimed synergy without the arm needed to test itAbsorptionenhancementor solubilizationMetabolism ortransporterchangePhysicochemicalprotectionAntagonism oradversePharmacodynamic(claimed)Not separatedStrongestevidenceAscorbic acid + non-heme iron (with phytate)Ascorbic acid + non-heme iron (with phytate): Absorption enhancement or solubilizationHuman PKAscorbic acid across a whole dietAscorbic acid across a whole diet: Absorption enhancement or solubilizationHuman PKPolyphenol beverages + non-heme ironPolyphenol beverages + non-heme iron: Antagonism or adverseHuman PKTurmeric or chili + iron-fortified mealTurmeric or chili + iron-fortified meal: Antagonism or adverseHuman PKCalcium + ironCalcium + iron: Antagonism or adverseHuman PKDietary fat + carotenoidsDietary fat + carotenoids: Absorption enhancement or solubilizationHuman PKPiperine + curcuminPiperine + curcumin: Metabolism or transporter changeHuman PK · safetyPiperine + CYP3A4 or P-gp drugsPiperine + CYP3A4 or P-gp drugs: Metabolism or transporter changeIn vitro · safetyGreen tea catechins + ascorbic acid + sucroseGreen tea catechins + ascorbic acid + sucrose: Physicochemical protectionAnimal, in vitroSt John's wort + CYP3A4 substratesSt John's wort + CYP3A4 substrates: Metabolism or transporter changeHuman PK · safetyGreen tea catechins + caffeineGreen tea catechins + caffeine: Not separatedMeta-analysisCurcumin extract + boswellic acidCurcumin extract + boswellic acid: Pharmacodynamic (claimed)Human RCTTen of twelve rows sit in the first four columns. The boswellia pair could not test synergy: the trial had no boswellia-alone arm. Safety: a documented safety concern.
Rows and evidence tags as in the catalog table below.
Seven quantified findings on one scale: what the partner did to absorption or exposure, with versus without itPrimary studies
Human studyAnimal studyBars: reported ranges
Data table
Ratio of absorption or exposure with the partner to without it
FindingRatio (with ÷ without)As reportedStudy
Piperine 20 mg + curcumin 2 g: serum curcumin (8 volunteers)≈20 (plotted)"the increase in bioavailability was 2000%"Shoba et al. 1998
Green tea extract + sucrose + ascorbic acid, rats: EGCG AUC₀–₆ h2.98 (derived)181.8 versus 61.0 pmol·h/LPeters et al. 2010
St John's wort 300 mg three times daily, 14 days: alprazolam AUC≈0.5 (plotted)"a 2-fold decrease"Markowitz et al. 2003
Chili with an iron-fortified meal: iron absorption0.62 (derived)6.0% versus 9.7%Tuntipopipat et al. 2006
Calcium 300–600 mg with wheat rolls: iron absorption0.40–0.50 (derived)reduced by 50–60%Hallberg et al. 1991
Phytate 250 mg phosphorus with wheat rolls: iron absorption0.18 (derived)inhibited by 82%Hallberg et al. 1989
Black tea with a bread meal: iron absorption0.06–0.21 (derived)reduced by 79–94%Hurrell et al. 1999

Not plotted because no value is reported in the abstract: turmeric 0.5 g with the same iron-fortified meal (no inhibition, P = 0.91; Tuntipopipat et al. 2006); ascorbic acid against phytate (significantly counteracted the inhibition; Hallberg et al. 1989); dietary fat with salad carotenoids (Brown et al. 2004).

Abstracts of the studies in the catalog table below. Ratios are derived from the reported percentages or means; designs, populations and endpoints differ, so the points show direction and size within each study, not a ranking of ingredients. Shoba et al. (1998) state that "the increase in bioavailability was 2000%"; the chart plots this as a 20-fold ratio. Read strictly as a 2,000% increase over the baseline it would be 21-fold; on the log axis the two positions differ by 0.02 decade and no comparison changes.

Most measured partners lowered absorption; the two that raised exposure acted through metabolism or chemical protection, and none of these measurements tests action at a shared target.

Evidence key:Traditional useIn vitroAnimalHuman PK/absorptionHuman RCTMeta-analysis of RCTsNot assessedDocumented safety concern

All sources were opened in PubMed, NIH ODS or NCCIH on October 22, 2026; full references are on the Sources page. The NCCIH and ODS pages are summaries for consumers and health professionals, not new studies.
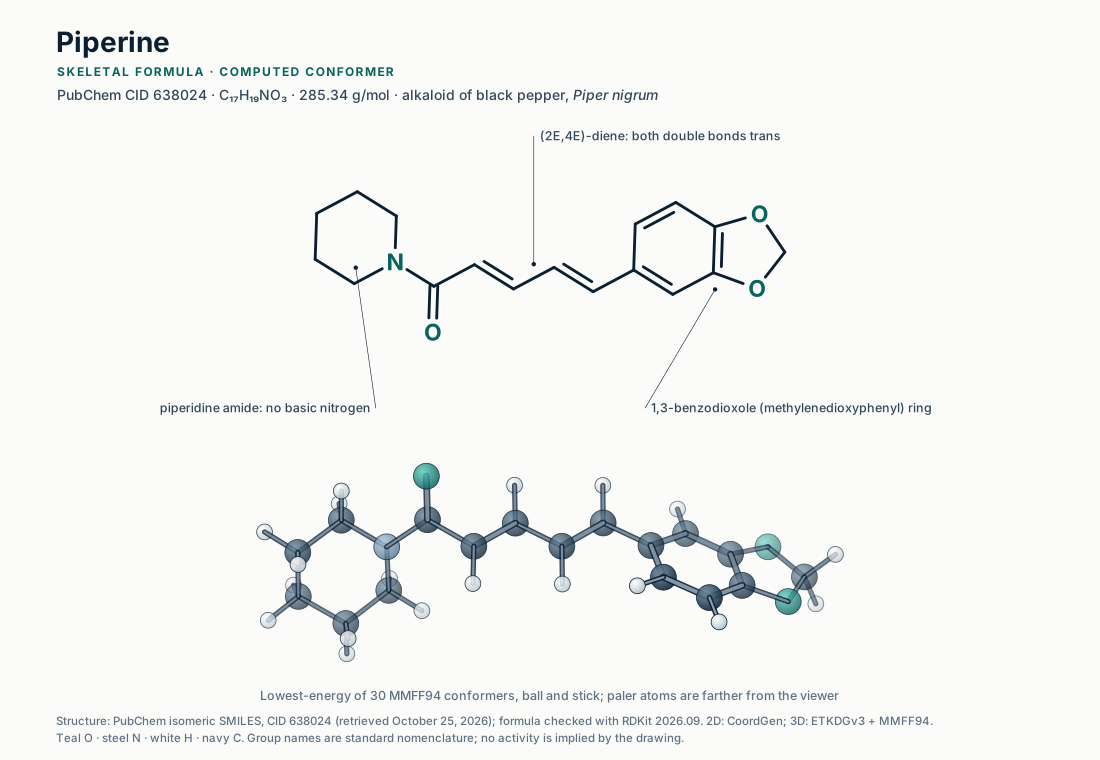
Piperine is a neutral amide: a benzodioxole ring and a trans,trans-diene joined to piperidineReference structure, computed conformer
Skeletal formula of piperine, C17H19NO3, molar mass 285.34 g/mol: a 1,3-benzodioxole ring joined by a (2E,4E)-diene chain to a carbonyl that forms an amide with piperidine. Below, a ball-and-stick view of one computed three-dimensional conformer.
Structure: PubChem isomeric SMILES, CID 638024 (retrieved Oct 25, 2026); RDKit 2026.09 2D depiction; lowest-energy of 30 MMFF94 conformers (ETKDGv3). Generated illustration, EUTECNIQ. Full-size SVG
Explanation, details and sources

Each row comes from a primary study, a meta-analysis or an NIH fact sheet that we opened and checked. The tag gives the strongest evidence type for the stated finding, not for any health benefit.

Verified combination findings with mechanism, design, result, evidence level and source
CombinationMechanismWhat was measuredResultEvidenceSource
Ascorbic acid + non-heme iron (with phytate)Absorption enhancementRadio-iron absorption from wheat rolls with added phytate, adultsPhytate inhibited absorption by 18% at 2 mg, 64% at 25 mg and 82% at 250 mg phytate phosphorus; added ascorbic acid significantly counteracted the inhibitionHuman PK/absorptionHallberg et al. Am J Clin Nutr 1989;49:140–144. NIH ODS: vitamin C "enhances the bioavailability of nonheme iron"
Ascorbic acid across a whole dietAbsorption enhancement, weaker in contextIron absorption from a complete, freely chosen diet over three 5-day periods, 12 adults, 51–247 mg/day vitamin CNo significant difference in mean absorption between periods; the authors conclude the effect is "far less pronounced" than in single-meal testsHuman PK/absorptionCook & Reddy. Am J Clin Nutr 2001;73:93–98
Polyphenol-rich beverages + non-heme ironAntagonism (polyphenol binding)Erythrocyte incorporation of radio-iron from a bread meal taken with black tea, herb teas, cocoa or coffee, adultsBlack tea reduced absorption by 79–94%, peppermint tea 84%, cocoa 71%, chamomile 47%; 100–400 mg total polyphenols per serving reduced absorption by 60–90%Human PK/absorptionHurrell, Reddy & Cook. Br J Nutr 1999;81:289–295
Turmeric or chili + iron-fortified mealAntagonism for chili; none detected for turmericStable-isotope iron absorption, randomized crossover, 10 women per studyChili (25 mg polyphenols) reduced absorption by 38% (6.0% vs 9.7%); turmeric (0.5 g, 50 mg polyphenols) did not inhibit it (P = 0.91)Human PK/absorptionTuntipopipat et al. J Nutr 2006;136:2970–2974
Calcium + ironAntagonism (mucosal transfer)Iron absorption from wheat rolls with 40–600 mg added calcium, 126 adultsDose-related inhibition up to 300 mg; 300–600 mg calcium reduced absorption by 50–60%, and heme iron absorption also fell. NIH ODS notes the effect "has not been definitively established"Human PK/absorptionHallberg et al. Am J Clin Nutr 1991;53:112–119; NIH ODS iron fact sheet (Sep 4, 2025)
Dietary fat + carotenoids (salad vegetables)Solubilization for absorptionChylomicron carotenoids for 12 h after salads with 0, 6 or 28 g canola oil, crossover, 7 adultsNegligible appearance of α-carotene, β-carotene and lycopene with fat-free dressing; more with reduced-fat (P < 0.04) and more again with full-fat dressing (P < 0.02)Human PK/absorptionBrown et al. Am J Clin Nutr 2004;80:396–403
Piperine + curcuminMetabolism inhibition (glucuronidation)Serum curcumin after 2 g curcumin with or without 20 mg piperine, healthy volunteers; rats in parallelBioavailability increased by 2000% in humans and 154% in rats. The human arm had 8 participants, 6-hour sampling and curcumin alone mostly below detection (UK COT 2024); a 30-person crossover found no significant difference between a piperine product and a standard extract at matched curcuminoid dose (Fança-Berthon et al. 2021). NCCIH: combining curcumin with piperine is one way to raise bioavailability, and "highly bioavailable formulations of curcumin … may harm your liver"Human PK/absorption Documented safety concernShoba et al. Planta Med 1998;64:353–356; COT/2024/07; Fança-Berthon et al. J Nutr 2021;151:1802–1816; NCCIH turmeric (Apr 2025). Details: Course 8
Piperine + drugs cleared by CYP3A4 or P-glycoproteinEnzyme and transporter inhibition (interaction risk)Digoxin and cyclosporine transport in Caco-2 cells; verapamil metabolism in human liver microsomesP-glycoprotein transport inhibited (IC50 15.5 and 74.1 µM); CYP3A4 metabolite formation inhibited (Ki 36–77 µM). The authors conclude dietary piperine could affect plasma levels of such drugsIn vitro Documented safety concernBhardwaj et al. J Pharmacol Exp Ther 2002;302:645–650
Green tea catechins + ascorbic acid + sucrosePhysicochemical protectionPlasma catechins in rats after 50 mg green tea extract in four formulations; in vitro digestion with Caco-2 uptakeEGCG AUC0–6h 181.8 vs 61.0 pmol·h/L, and EGC 3237.0 vs 1304.1, with sucrose and ascorbic acid versus plain extract; catechin retention higher with ascorbic acidAnimal In vitroPeters, Green, Janle & Ferruzzi. Food Res Int 2010;43:95–102
St John's wort + CYP3A4 substratesEnzyme induction (adverse interaction)Alprazolam kinetics before and after 14 days of St John's wort 300 mg three times daily, 12 healthy adultsAlprazolam AUC fell 2-fold and half-life fell from 12.4 to 6.0 h. Mechanism: hyperforin binds the pregnane X receptor (Ki 27 nM) that regulates CYP3A4. NCCIH lists weakened oral contraceptives, cyclosporine, HIV drugs and warfarinHuman PK/absorption Documented safety concernMarkowitz et al. JAMA 2003;290:1500–1504; Moore et al. PNAS 2000;97:7500–7502; NCCIH St John's wort (May 2025)
Green tea catechins + caffeineNot separated (mixture tested)Random-effects meta-analysis of 11 articles on weight loss and maintenanceCatechins or an EGCG–caffeine mixture: −1.31 kg; the authors call the effect "small positive", with habitual caffeine intake and ethnicity as possible moderatorsMeta-analysis of RCTsHursel, Viechtbauer & Westerterp-Plantenga. Int J Obes 2009;33:956–961
Curcumin extract + boswellic acid (botanical pair)Claimed pharmacodynamic synergy, not tested12-week double-blind trial, 201 patients with knee osteoarthritis, three arms: curcumin complex, curcumin plus boswellic acid, placeboThe combination beat placebo on physical-performance tests and WOMAC pain; curcumin alone beat placebo only on performance tests. With no boswellic-acid-alone arm, synergy cannot be separated from boswellia's own effectHuman RCTHaroyan et al. BMC Complement Altern Med 2018;18:7 (NCT02390349)
Dose dependency

Inhibition of iron absorption rose with the amount of phytate, and every polyphenol beverage tested reduced absorption

Iron absorption from a test meal, reduced by phytate dose and by polyphenol-rich beveragesHuman studies
Data table
Inhibition of non-heme iron absorption by phytate dose and by beverages
Added to the mealReduction in iron absorptionStudy
Phytate, 2 mg phytate phosphorus18%Hallberg et al. 1989
Phytate, 25 mg64%Hallberg et al. 1989
Phytate, 250 mg82%Hallberg et al. 1989
Black tea79–94%Hurrell et al. 1999
Peppermint tea84%Hurrell et al. 1999
Pennyroyal tea73%Hurrell et al. 1999
Cocoa71%Hurrell et al. 1999
Vervain tea59%Hurrell et al. 1999
Lime-flower tea52%Hurrell et al. 1999
Chamomile tea47%Hurrell et al. 1999
Beverages with 20–50 mg total polyphenols per serving50–70%Hurrell et al. 1999
Beverages with 100–400 mg total polyphenols per serving60–90%Hurrell et al. 1999

Hallberg et al. tested seven phytate dose levels between 2 and 250 mg; the abstract reports these three. All three reductions had P < 0.001.

Hallberg L, Brune M, Rossander L. Iron absorption in man: ascorbic acid and dose-dependent inhibition by phytate. Am J Clin Nutr. 1989;49:140–144 (wheat rolls, two radioiron labels). Hurrell RF, Reddy M, Cook JD. Inhibition of non-haem iron absorption in man by polyphenolic-containing beverages. Br J Nutr. 1999;81:289–295 (bread meal, erythrocyte incorporation of radioiron, versus a water control). Abstract values.

A combination's effect depends on the amount of each partner, so a formula's interaction screen states doses, not just ingredient names.
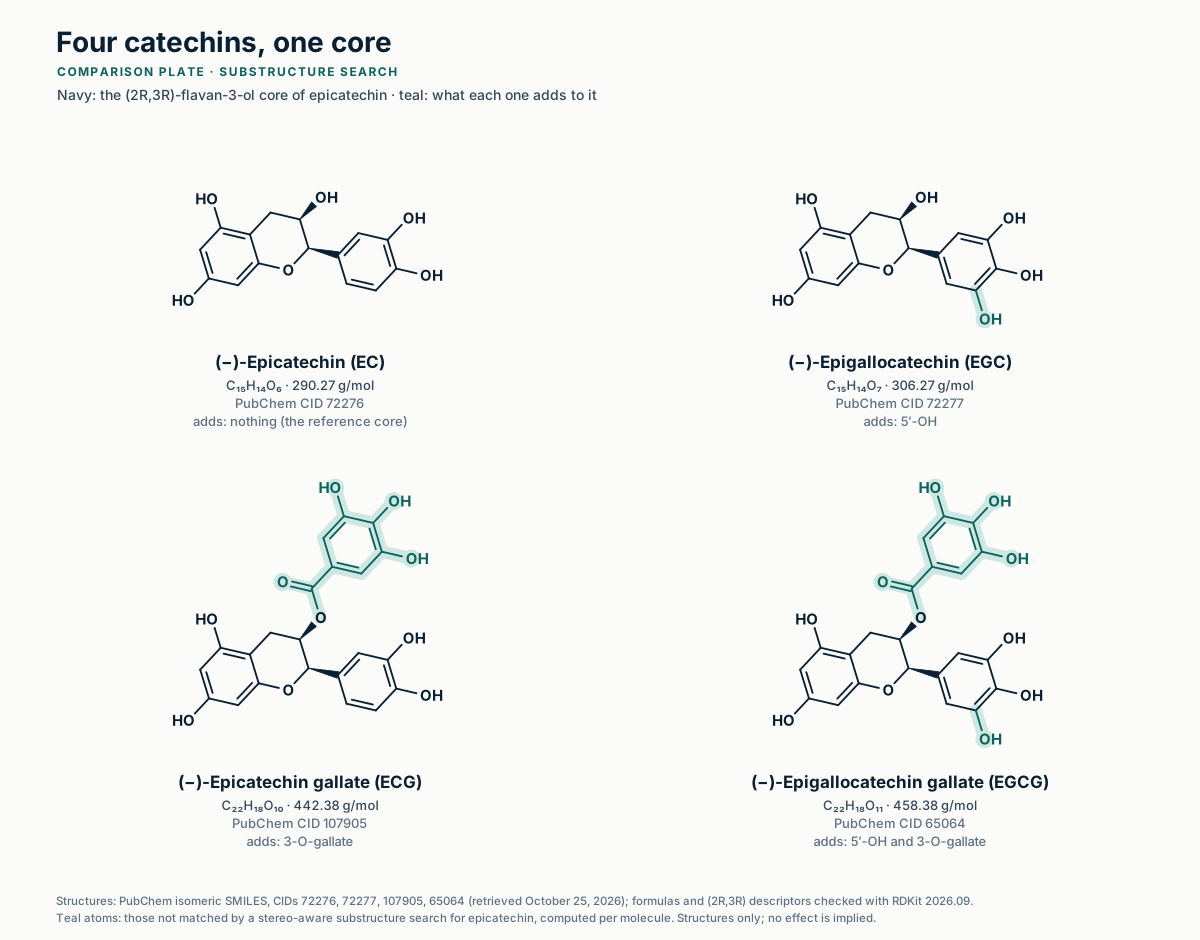
Green tea's four main catechins share one flavan-3-ol core and differ by a third B-ring hydroxyl and a gallate esterReference structures
Skeletal formulas of epicatechin, epigallocatechin, epicatechin gallate and epigallocatechin gallate. All share the (2R,3R)-flavan-3-ol core of epicatechin, drawn in navy; the parts each adds to that core, a third hydroxyl on the B ring and a gallate ester on the 3-oxygen, are drawn in teal.
Structures: PubChem isomeric SMILES, CIDs 72276, 72277, 107905, 65064 (retrieved Oct 25, 2026); RDKit 2026.09 2D depiction; highlights from an RDKit stereo-aware substructure search. Generated illustration, EUTECNIQ. Full-size SVG
Reference models

Whether a combination looks synergistic depends on the reference model: Loewe and Bliss expect different effects from the same two curves

Single agents (Hill, Emax = 1) · Loewe · BlissEA = unAunA + 1, u = aEC50,A
uU(E) + vV(E) = 1
EBliss = EA + EB − EAEB
A alone50.0%
B alone50.0%
Highest single agent50.0%
Loewe expectation72.4%
Bliss expectation75.0%
Bliss − Loewe+2.6 pts
Assumptions
  • Both agents reach the same maximum effect (Emax = 1) and follow Hill curves; doses are in units of each agent's own EC50, so the EC50 values themselves drop out
  • Slopes are illustrative, not fitted to any ingredient
  • These are expectations for non-interaction; no observed data are shown
Bliss minus Loewe expectation, percentage pointsIllustrative model
Show data: expectations at equal normalized doses for the current slopes

Hill slope of A 1.0, of B 2.0

Dose of each (× own EC50)A aloneB aloneHighest single agentLoeweBlissBliss − Loewe
0.19.1%1.0%9.1%12.1%10.0%−2.1 pts
0.323.1%8.3%23.1%34.0%29.4%−4.6 pts
150.0%50.0%50.0%72.4%75.0%+2.6 pts
375.0%90.0%90.0%93.5%97.5%+4.0 pts
1090.9%99.0%99.0%99.2%99.9%+0.7 pts
Drag the surface or use the buttons to rotate it. The amber band marks dose pairs where the two models agree within 2 percentage points; outside it, the same observed effect could be called synergy under one model and antagonism under the other.Equations: Tang J, Wennerberg K, Aittokallio T. Front Pharmacol. 2015;6:181 (Eq. 1–2); Greco WR, Bravo G, Parsons JC. Pharmacol Rev. 1995;47:331–385. Computed by EUTECNIQ in the browser.
Method, assumptions and limits: reference-model surfaces
What it calculates
The effect expected if two agents do not interact, under Loewe additivity and under Bliss independence, and their difference, over a grid of doses from 0.03 to 30 times each agent's EC50.
Equations
Single agent: E(u) = un/(un + 1), inverse U(E) = (E/(1 − E))1/n. Loewe: the E that solves u/U(E) + v/V(E) = 1, found by bisection on logit(E). Bliss: EA + EB − EAEB. Highest single agent: max(EA, EB).
Variables and units
u, v: doses divided by each agent's EC50 (dimensionless). nA, nB: Hill slopes, 0.5–3. Effects in % of the common maximum.
Assumptions
Equal maximum effects; monotonic Hill curves; no observed combination data. When maxima differ, Loewe additivity is not defined above the lower maximum.
Checks
With both slopes equal to 1, Bliss − Loewe = uv/((1 + u)(1 + v)(1 + u + v)), which is 8.33 points at u = v = 1. A drug combined with itself (equal slopes) gives Loewe E = E(u + v), the "sham combination" property. Browser readouts match an independent Python reference (scipy brentq).
Does not establish
That any real pair is synergistic, additive or antagonistic; a dose; or an effect in people. It shows only why the reference model must be stated.
Isobologram at effect level x, normalized axess = aAx, w = bBx
Loewe: s + w = 1
CI = s + w on the Bliss isobole

Hill slopes come from the surface controls above.

Loewe CI of a Bliss-additive mixture, equal shares1.087
Bliss isobole: w at s = 0.50.577

outside the Loewe line: a Bliss-additive mixture would be called antagonistic under Loewe

Isoboles for the same pair under three reference modelsIllustrative model
Points below the Loewe line need less of both partners than dose additivity predicts. A mixture that exactly meets the Bliss expectation has a Loewe combination index (CI) below 1 when its isobole bends inward and above 1 when it bends outward.Loewe line and combination index as in Chou TC. Cancer Res. 2010;70:440–446; Bliss isobole computed from Tang et al. 2015, Eq. 1.
Method, assumptions and limits: isobologram
What it calculates
At effect level x, the dose pairs that give x under Bliss independence, plotted in units of each agent's single-agent dose for x (Ax, Bx), with the Loewe line and the highest-single-agent boundary.
Equations
Ax = EC50,A(x/(1 − x))1/nA. For each s, w solves EBliss(s Ax, w Bx) = x by bisection. On the ray s = w = t, the Loewe combination index of the Bliss-additive mixture is CI = 2t.
Checks
Slopes 1 and 1 at x = 50%: CI = 2(√2 − 1) = 0.828. Slopes 2 and 2: CI = 2(√2 − 1)1/2 = 1.287. Matches the Python reference.
Does not establish
A combination index from data; real CIs need replicated dose-response data and confidence intervals. For the Chou–Talalay calculator and a Bliss dose-matrix calculator, see Clinical research.
Explanation, details and sources

Synergy means "more than expected," so the expectation must be stated. Loewe additivity treats the partners as dilutions of one another; Bliss independence treats them as acting separately. With Hill slopes of 1, Bliss expects more effect than Loewe everywhere; with steeper slopes it can expect less.

Proving synergy in people

A 2 × 2 factorial trial can test an interaction, but one as large as the main effect needs four times the participants

The four arms of a 2 × 2 factorial trial and the contrasts they supportDesign schematic
Ingredient A noyes Ingredient B noyes Placeboμ0, N/4 A aloneμA, N/4 B aloneμB, N/4 A + BμAB, N/4 Interaction = (μAB − μB) − (μA − μ0) Main effect of A = right column minus left column
Design logic: Montgomery AA, Peters TJ, Little P. BMC Med Res Methodol. 2003;3:26. For fixed-combination drugs, FDA's rule that each component must contribute (21 CFR 300.50) is discussed on Clinical research.
Total sample size, 2 × 2 factorial, equal armsNmain = 4σ²(z1−α/2 + z1−β)²δ²
Nint = 16σ²(z1−α/2 + z1−β)²(kδ)²
N for the main effect128
N for the interaction504
Inflation factor× 4.00
Interaction power at the main-effect N29.3%
Method, assumptions and limits: factorial-trial sample size
What it calculates
Total participants for a 2 × 2 factorial trial with a continuous outcome to detect (a) the main effect of one ingredient and (b) the interaction between the two, and the power that the main-effect sample size gives for the interaction.
Equations
Equal allocation, N/4 per arm. Main effect of A (mean of the two A arms minus mean of the two non-A arms): variance 4σ²/N. Interaction contrast (μAB − μB) − (μA − μ0): variance 16σ²/N. Required N from the normal approximation, rounded up to a multiple of 4. Interaction power = Φ(zI − z1−α/2) + Φ(−zI − z1−α/2), zI = kδ/√(16σ²/N).
Variables and units
σ 1–50 and δ 0.5–30, in the outcome's units; k 0.1–2; α 0.05 or 0.01; power 80% or 90%.
Assumptions
Known, equal variance in all arms; no dropout; one primary outcome; normal approximation. "Interaction of the same size" means the difference of differences equals δ, as in Brookes et al.
Valid range
Reliable for totals above about 40; smaller trials need t-distribution methods.
Benchmark
With k = 1 the inflation factor is exactly 4, and at the exact main-effect N (80% power, α 0.05) interaction power is 28.8%, the 29% reported by Brookes et al.; the readout uses N rounded up to a multiple of 4 (29.3% at the defaults). Browser values match an independent Python reference (scipy.stats.norm).
Does not establish
The effect size, SD or dropout for any product; these must come from prior data. It does not replace a statistician's design.
References
Brookes ST et al. J Clin Epidemiol. 2004;57:229–236. Montgomery AA, Peters TJ, Little P. BMC Med Res Methodol. 2003;3:26.
Explanation, details and sources

In a factorial trial participants receive placebo, A, B or both. Main effects compare halves of the trial; the interaction compares a difference of differences between quarters, so its variance is four times larger. Brookes et al. found that a trial with 80% power for an overall effect had only 29% power for an interaction of the same size.

Proposed practice

EUTECNIQ would claim only what each level of combination evidence supports, and would screen every formula for interaction risk first

A management proposal for combination projects; none has been performed.

Four steps, each able to support only its own kind of claimProposed practice
Proposed four-step practice for combination projects: interaction screen, dose-matrix study, human pharmacokinetic study and, only for a synergy claim, a factorial trial; each step supports only its own claim1. Interaction screen2. Dose-matrix study3. Human PK study4. Factorial trialEach partner checked fordocumented CYP, transporter andmineral-absorption effects beforeformulationCan show: a known interaction riskReplicated in vitro matricesanalyzed against Loewe and Bliss,with ratio, effect level anduncertaintyCan show: in vitro synergy under astated modelWhether one partner changes theother's exposure; safetyreassessed at the higher exposureCan show: pharmacokineticenhancement in peoplePlacebo, A, B and A + B arms,powered for the interaction; onlywhere a synergy claim is wantedCan show: an interaction in peopleProposed four-step practice for combination projects1Interaction screenEach partner checked for documented CYP,transporter and mineral-absorption effects beforeformulation. Can show: a known interaction risk.2Dose-matrix studyReplicated in vitro matrices analyzed against Loeweand Bliss, with ratio, effect level and uncertainty.Can show: in vitro synergy under a stated model.3Human PK studyWhether one partner changes the other's exposure;safety reassessed at the higher exposure. Canshow: pharmacokinetic enhancement in people.4Factorial trialPlacebo, A, B and A + B arms, powered for theinteraction; only where a synergy claim is wanted.Can show: an interaction in people.
EUTECNIQ proposal. Combination-index and Bliss dose-matrix calculators: Clinical research.
Text version of the four steps
  1. Interaction screenCheck each partner for documented effects on CYP enzymes, transporters and mineral absorption before formulation, using sources such as those in the catalog above.
  2. Dose-matrix studyReplicated in vitro dose matrices, analyzed against both Loewe and Bliss with the ratio, effect level and uncertainty stated.
  3. Human PK studyMeasure whether one partner changes the other's exposure, and reassess safety at the higher exposure.
  4. Factorial trialOnly where a synergy claim is wanted: placebo, A, B and A + B arms, powered for the interaction.

Related pages: Evidence and pharmacokinetics, Bioavailability design and Clinical research, which hosts the combination-index and Bliss dose-matrix calculators.

Planning a combination formula?

Start with the interaction screen and the claim you want to make. EUTECNIQ proposes to map both to the evidence each claim would need.