Analytical characterization Planned capabilityRules verified October 2026Illustrative schematics
Each analytical method answers one question, so a botanical is judged on several methods chosen for it
Twenty-one methods organized by the question each answers, with the validation vocabulary, the elemental limits and example workflows. For quality managers, partners and investors.
Status. EUTECNIQ has no instrument and no validated method. The core laboratory is planned for Phase I (facility plan, October 2026); until then, qualified external laboratories would run all testing.
21methods, each mapped to the questions it answers
8questions, from identity to microbiology, each covered by two or more methods
5 µg/daylead PDE for dietary supplements in USP ⟨2232⟩
10σ/Squantitation limit from a calibration line in ICH Q2(R2)
Counts: the proposed method matrix on this page. PDE: USP ⟨2232⟩ Table 1 (USP 38–NF 33 text). QL: ICH Q2(R2), November 2023.
What this page answers
A botanical is accepted on evidence from several methods, each fit for its purpose and each with known blind spots
EUTECNIQ would choose methods and review every result; partners would run all testing until the Phase I laboratory opensProposed division of work
Facility plan, October 2026: chromatography, mass spectrometry, elemental and microbiology laboratory core in Phase I. No instrument, method or result exists.Text version of the division of work
EUTECNIQ would
Select methods by question and by risk for each material
Develop, validate or verify methods for each matrix
Qualify instruments and keep data under audit trail
Review partner results against specifications
Proposed
Qualified partners would
Run all testing before EUTECNIQ's laboratory exists
Provide NMR, X-ray diffraction and DNA barcoding unless brought in-house
Supply accredited methods within their own scope
External partner
EUTECNIQ does not claim
Any instrument, validated method or result of its own
ISO/IEC 17025 accreditation, which it would seek later
That any method combination is required by regulation
Limits
A library or database match≠a confirmed identity
Identity of the plant≠purity or potency of the extract
A compendial method≠a method verified for this matrix
ISO/IEC 17025 accreditation≠GMP compliance
Detection limit≠quantitation limit
In vitro release≠bioavailability in people
Explanation, details and sources
Plants vary by species, origin, season and processing, and a profitable adulteration is designed to pass the test it expects. That is why identity, composition and contaminants are each tested with methods suited to the question, and why every method's limits are part of the result.
Methods by question
Twenty-one methods map onto eight questions, and every question is covered by at least two
Which method answers which question: 21 methods against 8 questionsProposed method plan
Drawn in the browser from the table below, so the two cannot disagree: ● answers the question directly, ○ gives supporting evidence. Select a question to sort the methods by it; hover or focus a cell for the method's planned access. EUTECNIQ's proposed selection logic, not a compendial requirement.
Identity and potency each draw on nine of the 21 methods; every question is covered by at least two methods, direct or supporting.
Show the table (21 rows): Analytical methods and the questions they answer
A filled circle marks a question the method answers directly; an open circle marks supporting evidence. Select a method to read its principle, use, limits and governing standard. Access follows the facility plan; none is operational.
● answers directly○ supporting evidencePhase I: in the laboratory core planned for 2027; phase not set: planned but not yet in the phase plan; partner laboratory: accessed externally.
The mapping is EUTECNIQ's proposed method-selection logic, not a compendial or regulatory requirement. Access assignments follow the facility plan as of October 2026 and would be confirmed before purchase.
Elemental contaminants
The daily intake sets how low lead, cadmium, arsenic and mercury must be measured
USP ⟨2232⟩, finished productCmax = PDE / m
Arsenic (inorganic)
Cadmium
Lead
Mercury (total)
Methylmercury (as Hg)
Daily exposure
Share of the PDE
Highest allowed content of each element as daily intake risesCompendial values
PDEs: USP ⟨2232⟩ Elemental Contaminants in Dietary Supplements, Table 1 (values as published in USP 38–NF 33; confirm in the current USP–NF). Arsenic and mercury share a PDE of 15 µg/day, and cadmium and lead 5 µg/day, so their lines coincide.Data table
USP ⟨2232⟩ PDE and the highest allowed content at four daily intakes (µg/g)
Element
PDE (µg/day)
1 g/day
2 g/day
5 g/day
10 g/day (Table 2)
Arsenic (inorganic)
15
15
7.5
3
1.5
Cadmium
5
5
2.5
1
0.5
Lead
5
5
2.5
1
0.5
Mercury (total)
15
15
7.5
3
1.5
Methylmercury (as Hg)
2
2
1
0.4
0.2
Method, assumptions and limits
What it calculates. The highest content of each element that keeps the daily exposure at or below the USP ⟨2232⟩ permitted daily exposure (PDE), for the chosen daily intake; and the exposure and share of the PDE for one measured result.
Equation.Cmax (µg/g) = PDE (µg/day) / m (g/day); exposure (µg/day) = content (µg/g) × m. The finished-product option of ⟨2232⟩ requires the measured amount per daily intake to be no more than the PDE.
Values. PDE (µg/day): arsenic (inorganic) 15, cadmium 5, lead 5, mercury (total) 15, methylmercury (as Hg) 2. At 10 g/day the result equals the chapter's Table 2 individual-component limits (1.5, 0.5, 0.5, 1.5, 0.2 µg/g).
Valid range. 0.5–25 g/day. The individual-component option applies to products taken at no more than 10 g/day; above that, ⟨2232⟩ points to the summation option.
What it does not establish. Compliance of any product, the method's quantitation limit, or limits under other rules (for example California Proposition 65 or the EU maximum levels); arsenic measured without speciation is assumed to be all inorganic.
References. USP ⟨2232⟩ (USP 38–NF 33 text; current official text on USP–NF). Verification. Independent reference in tests/numerics/ref/ana_elemental.py.
At 10 g a day, lead and cadmium are capped at 0.5 µg/g; at 1 g a day the same PDE allows 5 µg/g, so the method's quantitation limit follows the label dose.
Explanation, details and sources
USP ⟨2232⟩ sets permitted daily exposures for elemental contaminants in dietary supplements and offers options for compliance: analysis of the finished product, individual component limits (based on a maximum daily intake of 10 g) and a summation option for larger intakes. Inductively coupled plasma mass spectrometry (ICP-MS) is the usual technique; inorganic arsenic and methylmercury need speciation methods when a total result exceeds their limits.
United States Pharmacopeia. General Chapter ⟨2232⟩ Elemental Contaminants in Dietary Supplements, Tables 1 and 2 and options for compliance (USP 38–NF 33). See also quality standards.
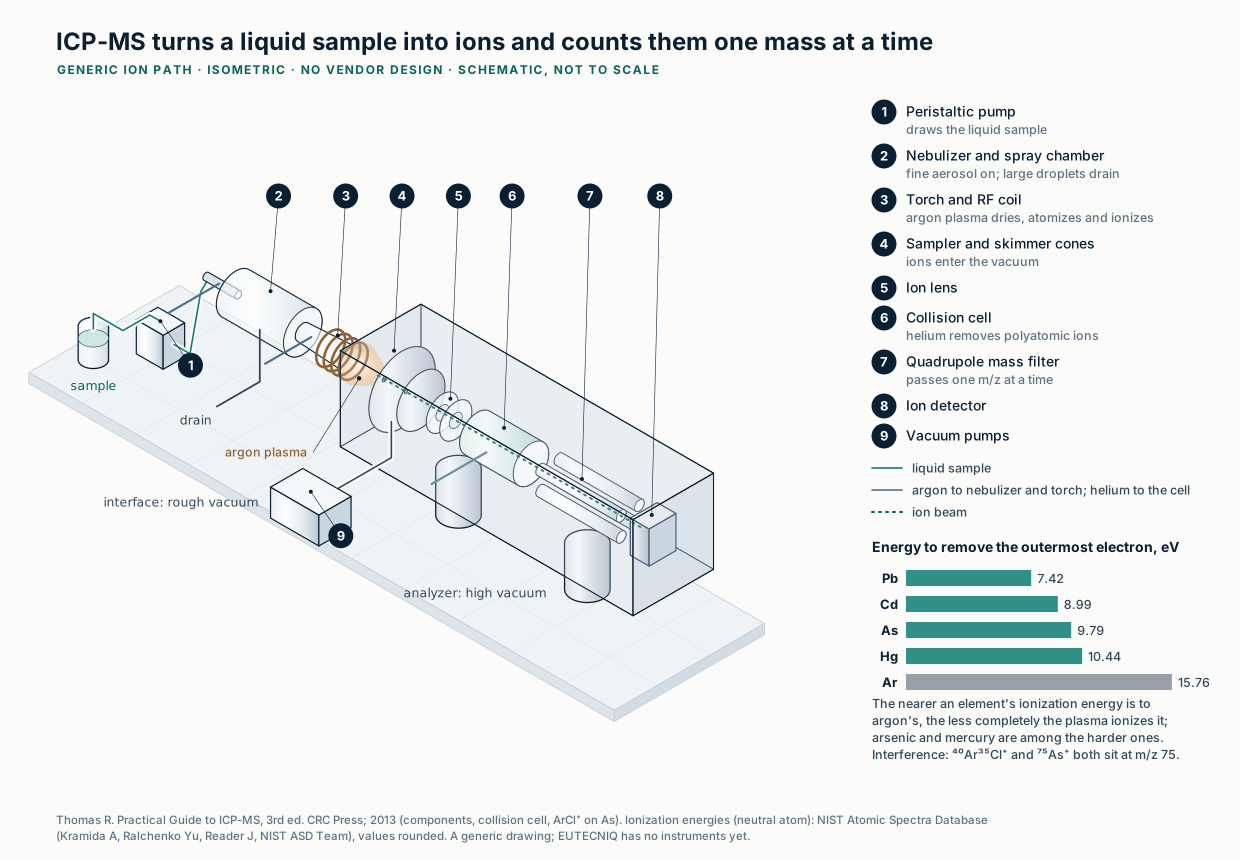
ICP-MS ionizes the sample in an argon plasma and counts ions one mass at a time; arsenic and mercury, with ionization energies nearer argon's, ionize less completelySchematic · NIST reference data
Thomas R. Practical Guide to ICP-MS, 3rd ed. CRC Press; 2013. Ionization energies: NIST Atomic Spectra Database. Generated illustration, EUTECNIQ; no instrument brand or model implied. Full-size SVG
Validation vocabulary
A result is only as good as the evidence that its method is fit for purpose
Each validation characteristic answers a different question about the same methodSchematic, shapes illustrative
ICH Q2(R2) and Q14 (adopted November 1, 2023; FDA final guidance, March 2024); 21 CFR 111.320 and 111.75; AOAC Appendix K (2019); USP ⟨1220⟩, ⟨1224⟩, ⟨1225⟩, ⟨1226⟩; Eurachem/CITAC Guide, 3rd ed. (2012). Peaks, dots and intervals are drawn to show the idea, not data.Text version: definitions and the rulebook for each product type
Specificity (selectivity)
The method measures the analyte without interference from matrix, impurities or degradation products. For botanicals this includes related species and look-alike constituents.
Accuracy
Closeness of the result to the true value, usually shown by recovery of a known amount added to the matrix or by a certified reference material.
Precision
Agreement among repeated results: repeatability (same analyst, same run), intermediate precision (different days, analysts or instruments) and reproducibility (between laboratories).
Range and response
The concentrations over which the method is shown to be accurate and precise, with a demonstrated calibration relationship (linear or not).
Detection limit (LOD)
The lowest amount that can be detected, not necessarily quantified. One ICH Q2(R2) approach: 3.3σ/S, from the standard deviation of the response σ and the calibration slope S.
Quantitation limit (LOQ)
The lowest amount that can be quantified with acceptable accuracy and precision; by the same approach, 10σ/S.
Robustness
Reliability under small, deliberate changes in method parameters, such as column temperature or mobile-phase pH. ICH Q2(R2) says it is typically evaluated during development and refers to ICH Q14.
Measurement uncertainty
A quantified range around a result within which the true value is expected to lie. ICH Q2(R2) does not address it; ISO/IEC 17025 laboratories must evaluate it, and the Eurachem/CITAC guide shows how to estimate it from validation data.
Validation, verification, transfer
Validation shows a new method is fit for purpose (USP ⟨1225⟩); verification shows a compendial method works in a given laboratory and matrix (USP ⟨1226⟩); transfer moves a validated method between laboratories (USP ⟨1224⟩). USP ⟨1220⟩ frames these as a life cycle.
Drug programs
ICH Q2(R2) and Q14
Adopted by ICH on November 1, 2023 and issued by FDA as final guidance in March 2024 (Q2(R2) docket FDA-2022-D-1503). Q14 covers analytical procedure development.
Final guidance
Dietary supplements
21 CFR 111.320 and 111.75
Methods must be appropriate for their intended use and scientifically valid; at least one appropriate test or examination must verify the identity of each dietary ingredient.
Regulation in force
Botanical methods
AOAC Appendix K
Guidelines for single-laboratory validation of chemical methods for dietary supplements and botanicals, and for botanical identification methods (AOAC Official Methods of Analysis, 2019).
Voluntary guideline
Detection and quantitation limits from a calibration lineIllustrative numbers
DL = 3.3σ/S and QL = 10σ/S, with σ from the residual standard deviation of the regression: ICH Q2(R2) Validation of Analytical Procedures (Step 4, November 1, 2023; FDA final guidance, March 2024). Seven calibration standards are invented for illustration.
For dietary supplements, FDA requires that laboratory methods be appropriate for their intended use and scientifically valid for each specification (21 CFR 111.320 and 111.75(h)). It does not prescribe a validation protocol. Drug programs use ICH Q2(R2); supplement and botanical methods often follow AOAC single-laboratory validation guidance.
21 CFR 111.320 and 111.75 (Cornell LII, accessed October 22, 2026); ICH Q2(R2) and Q14 (ICH, November 1, 2023; FDA final guidance March 2024); AOAC International, Appendix K: Guidelines for Dietary Supplements and Botanicals (2019); USP ⟨1220⟩ (official May 1, 2022), ⟨1224⟩, ⟨1225⟩, ⟨1226⟩; Singapore Accreditation Council, Technical Guide 2 on measurement uncertainty (2023); Ellison SLR, Williams A, eds. Eurachem/CITAC Guide: Quantifying Uncertainty in Analytical Measurement. 3rd ed. 2012.
Orthogonal methods
Independent methods catch different failures, because every method has a blind spot
A single-marker assay cannot tell an extract from cheaper material spiked with the marker; a whole-profile method such as LC-HRMS is likely to.
Explanation, details and sources
21 CFR 111.75(a)(1)(i) requires at least one appropriate test or examination for the identity of each dietary ingredient; it does not prescribe a combination. One test can be fooled: Wohlmuth and colleagues found Ginkgo products whose flavonol content had been raised with added aglycones, which assays that hydrolyze glycosides cannot distinguish. Pairing methods built on different physics narrows what can pass unnoticed.
The ratings are EUTECNIQ's proposed method-selection logic; the identity rule is verified (21 CFR 111.75(a)(1)(i), October 2026).
Which failure each method is likely to revealMethod-selection logic
Show the ratings as a table
Scenario
Microscopy (crude material)
HPTLC fingerprint
Single-marker assay
LC-HRMS profile
Wrong species or plant part
likely to reveal
likely to reveal
may reveal
likely to reveal
Cheaper material spiked with the marker
may reveal
may reveal
blind spot
likely to reveal
Diluted with an inert filler
may reveal
may reveal
likely to reveal
may reveal
21 CFR 111.75(a)(1)(i), via Cornell LII; Wohlmuth H, et al. Phytomedicine. 2014;21(6):912–918; USP ⟨563⟩ Identification of Articles of Botanical Origin. Ratings are EUTECNIQ's qualitative judgment, not validated detection limits.
Example workflows
Three example workflows show how methods combine for a raw material, a dried extract and a nanoemulsion
A raw material, a dried extract and a nanoemulsion each need a different mix of identity, assay, contaminant and physical testsProposed examples
Identity requirement: 21 CFR 111.75(a)(1). Pesticide residues: USP ⟨561⟩. Residual solvents: USP ⟨467⟩. Microbiology: USP ⟨2021⟩–⟨2023⟩. Workflows are EUTECNIQ proposals, not standard operating procedures.Text version of the three workflows
Real test plans would follow each material's specification, risk assessment and regulatory category; these three are examples.
Incoming powdered root, before it is released to production
Receipt and samplingQuarantine; sample by written plan
MicroscopyDiagnostic tissues against an authenticated specimen
HPTLC fingerprintSide by side with botanical reference material
Marker assayHPLC against a reference standard
Contaminants by riskICP-MS elements; GC-MS/MS and LC-MS/MS pesticides; microbiology
Quality reviewResults against specification; release or reject
Spray-dried extract, at release and on stability
Assay and fingerprintUHPLC marker assay; profile against reference lots
WaterKarl Fischer and water activity
Residual solventHeadspace GC-FID for extraction ethanol
ContaminantsElements and microbiology against limits
Solid stateXRPD and DSC in development and on stability
Particle sizeLaser diffraction for flow and blending
Nanoemulsion candidate, during development
Droplet sizeDLS z-average and polydispersity
Large-droplet tailLaser diffraction
Surface chargeZeta potential at product pH
Active contentAssay of the active, physically separate from size
Storage and stressRepeat at time points; dilution, pH and temperature cycles
Methods in depth
How each method works and where it falls short, grouped by question
Status. None of these methods is operational at EUTECNIQ; each card gives its planned access.
Identity and structure methods
Macroscopic and microscopic botanical examination
Measures
Identity of crude and powdered plant material from diagnostic tissues: trichomes, stomata, crystals, starch grains, fibers and vessels.
Principle, botanical use, limits and standard
Principle
A trained botanist compares the sample with an authenticated reference under a light microscope, using stains and polarized light where useful.
Botanical use
Identity of incoming plant material; detecting foreign plant parts or species; supplier qualification.
Limits
Extracts lose cellular structure, so microscopy suits crude and powdered material, not finished extracts. It needs skilled analysts and authenticated reference specimens.
Standard
USP ⟨563⟩ Identification of Articles of Botanical Origin; USP ⟨776⟩ Optical Microscopy; 21 CFR 111.75(h) lists macroscopic and microscopic analysis among acceptable methods.
Planned · Phase I
HPTLC: samples and a botanical reference develop side by side on one plate, so a missing or extra zone is visible at a glanceIllustrative schematic
USP ⟨203⟩; Reich E, Schibli A. High-Performance Thin-Layer Chromatography for the Analysis of Medicinal Plants. Thieme; 2007. Plotted traces are representative shapes, not measured data.
High-performance thin-layer chromatography
What it measures, use, limits and standard
Measures
A fingerprint of many constituents at once, compared track by track with a botanical reference material.
Botanical use
Identity of raw materials and extracts; detecting substitution with related species; supplier qualification.
Limits
Mostly qualitative or semi-quantitative; lower resolving power than HPLC; results depend on the reference material and on controlled humidity and chamber saturation.
Standard
USP ⟨203⟩ High-Performance Thin-Layer Chromatography Procedure for Identification of Articles of Botanical Origin.
Samples are applied as narrow bands. The mobile phase rises through the layer by capillary action, and each constituent migrates a characteristic fraction of the solvent-front distance (Rf). Derivatization reagents and viewing under UV 254 nm, UV 366 nm or white light reveal the zones; a densitometer converts tracks into intensity profiles.
Key relationRf = zone distance / solvent-front distanceMeasured from the application line; each zone is compared with the same zone in the reference track.
Planned · Phase I
FTIR-ATR: a Michelson interferometer encodes every infrared wavelength at once; total internal reflection samples only the layer touching the crystalIllustrative schematic
USP ⟨854⟩, ⟨197⟩; Griffiths PR, de Haseth JA. Fourier Transform Infrared Spectrometry. 2nd ed. Wiley; 2007. Plotted traces are representative shapes, not measured data.
Fourier-transform infrared spectroscopy with ATR
What it measures, use, limits and standard
Measures
A mid-infrared fingerprint of functional groups, from about 4000 to 400 cm⁻¹, with little sample preparation.
Botanical use
Fast identity screening of raw materials and excipients against reference spectra; with chemometric models, screening for gross substitution.
Limits
Bands overlap in mixtures, so similar extracts can give similar spectra. Conclusions depend on validated libraries or models. Water absorbs strongly.
A beamsplitter sends light to a fixed and a moving mirror; their recombination produces an interferogram as the moving mirror travels. A Fourier transform turns the interferogram into a spectrum. In attenuated total reflection (ATR), the beam reflects inside a crystal and an evanescent wave probes only the sample pressed against it.
Key relationB(ν̃) = FT[ I(δ) ]The spectrum B over wavenumber ν̃ is the Fourier transform of the interferogram I recorded against optical path difference δ.
Planned · phase not set
Raman: a laser excites the sample, a filter removes the laser line, and the weak scattered light shifted by molecular vibrations forms the spectrumIllustrative schematic
USP ⟨858⟩, ⟨1858⟩ (listed by Biba E, Pappa H. Spectroscopy. 2023;38(S3):5–8). Spectrum shapes are illustrative. Plotted traces are representative shapes, not measured data.
Raman spectroscopy
What it measures, use, limits and standard
Measures
A vibrational fingerprint complementary to infrared, including through glass or clear plastic packaging.
Botanical use
Fast identity checks of excipients and some raw materials, sometimes with handheld instruments through the bag; mapping crystalline forms.
Limits
Fluorescence from colored plant material can bury the much weaker Raman signal. The laser can heat dark samples. Identification depends on validated libraries or models.
Standard
USP ⟨858⟩ Raman Spectroscopy; USP ⟨1858⟩ Raman Spectroscopy—Theory and Practice.
Most scattered light keeps the laser wavelength; a tiny fraction is shifted by the energy of molecular vibrations. A notch or edge filter removes the laser line and a spectrograph with a CCD records the shifted light as intensity against Raman shift in cm⁻¹. Symmetric, non-polar bonds scatter strongly, and water scatters weakly.
Key relationν̃ = 1/λ₀ − 1/λ_sThe Raman shift is the difference between the wavenumbers of the laser (λ₀) and the scattered light (λ_s).
Planned · phase not set
NMR: a radio-frequency pulse tips nuclear magnetization in a strong field; the decaying signal is Fourier-transformed into a spectrumIllustrative schematic
USP ⟨761⟩, ⟨1761⟩; gyromagnetic ratio of ¹H, γp/2π = 42.577 MHz/T: CODATA 2022 (NIST SP 961); 600 MHz at 14.1 T: NTU NMR facility instrument page. Plotted traces are representative shapes, not measured data.
Nuclear magnetic resonance spectroscopy
What it measures, use, limits and standard
Measures
Molecular structure, including connectivity from two-dimensional experiments, and quantity: signal area is proportional to the number of nuclei, so an internal standard allows quantitative NMR.
Far less sensitive than mass spectrometry; overlapping signals in complex extracts; high capital cost and cryogen supply.
Standard
USP ⟨761⟩ Nuclear Magnetic Resonance Spectroscopy; USP ⟨1761⟩ Nuclear Magnetic Resonance Spectroscopy—Theory and Practice.
Nuclei with spin precess in the field of a superconducting magnet at a frequency proportional to the field. An RF pulse tips the magnetization; the free-induction decay (FID) recorded as it relaxes is Fourier-transformed into a spectrum whose chemical shifts reflect each nucleus's chemical environment.
Key relationν = γ B₀ / 2πFor ¹H, γ/2π ≈ 42.58 MHz per tesla, so a 14.1 T magnet gives a 600 MHz spectrometer.
Partner laboratory
Q-TOF: ions accelerated by the same voltage reach the detector in order of m/z; a reflectron sharpens arrival timesIllustrative schematic
USP ⟨736⟩ Mass Spectrometry; de Hoffmann E, Stroobant V. Mass Spectrometry: Principles and Applications. 3rd ed. Wiley; 2007; Makarov A. Anal Chem. 2000;72(6):1156–1162. Plotted traces are representative shapes, not measured data.
High-resolution LC-MS (Q-TOF or Orbitrap)
What it measures, use, limits and standard
Measures
Accurate mass for elemental formulas, MS/MS fragments for structure, and untargeted fingerprints of whole extracts.
Botanical use
Identifying constituents and unexpected adulterants; comparing lots; discovering candidate markers.
Limits
Compounds that ionize poorly are under-represented. Isomers share a mass. Signal intensity is not concentration without calibration standards, and database annotations are tentative.
Standard
USP ⟨736⟩ Mass Spectrometry.
After electrospray ionization, a quadrupole can select a precursor and a collision cell fragments it. A pusher accelerates the ions into a field-free flight tube; ions with the same kinetic energy travel at speeds set by m/z, so arrival time gives m/z. A reflectron compensates for spread in starting energy. Orbitrap analyzers instead measure the frequency of axial oscillation, ω = √(k/(m/z)).
Key relationt = L · √( m / 2zeU )Flight time t over path L for an ion of mass m and charge ze accelerated through potential U.
Planned · Phase I
Potency and purity methods
Liquid chromatography: a gradient pump, injector and column separate an extract in time; a diode array records a spectrum at every momentIllustrative schematic
Van Deemter JJ, Zuiderweg FJ, Klinkenberg A. Chem Eng Sci. 1956;5(6):271–289; USP ⟨621⟩ Chromatography. Plotted traces are representative shapes, not measured data.
HPLC / UHPLC with diode-array detection
What it measures, use, limits and standard
Measures
Marker compounds quantified against reference standards, and a UV chromatographic fingerprint of the extract.
Botanical use
Assay of specified markers; lot-to-lot fingerprint comparison; checking peak purity with spectra; analysis of dissolution samples.
Limits
Constituents without a chromophore are invisible to UV detection. Co-eluting peaks can be mistaken for one compound. Quantitation needs qualified reference standards, and one marker does not establish the identity of a whole extract.
Standard
USP ⟨621⟩ Chromatography; USP ⟨1225⟩ Validation of Compendial Procedures.
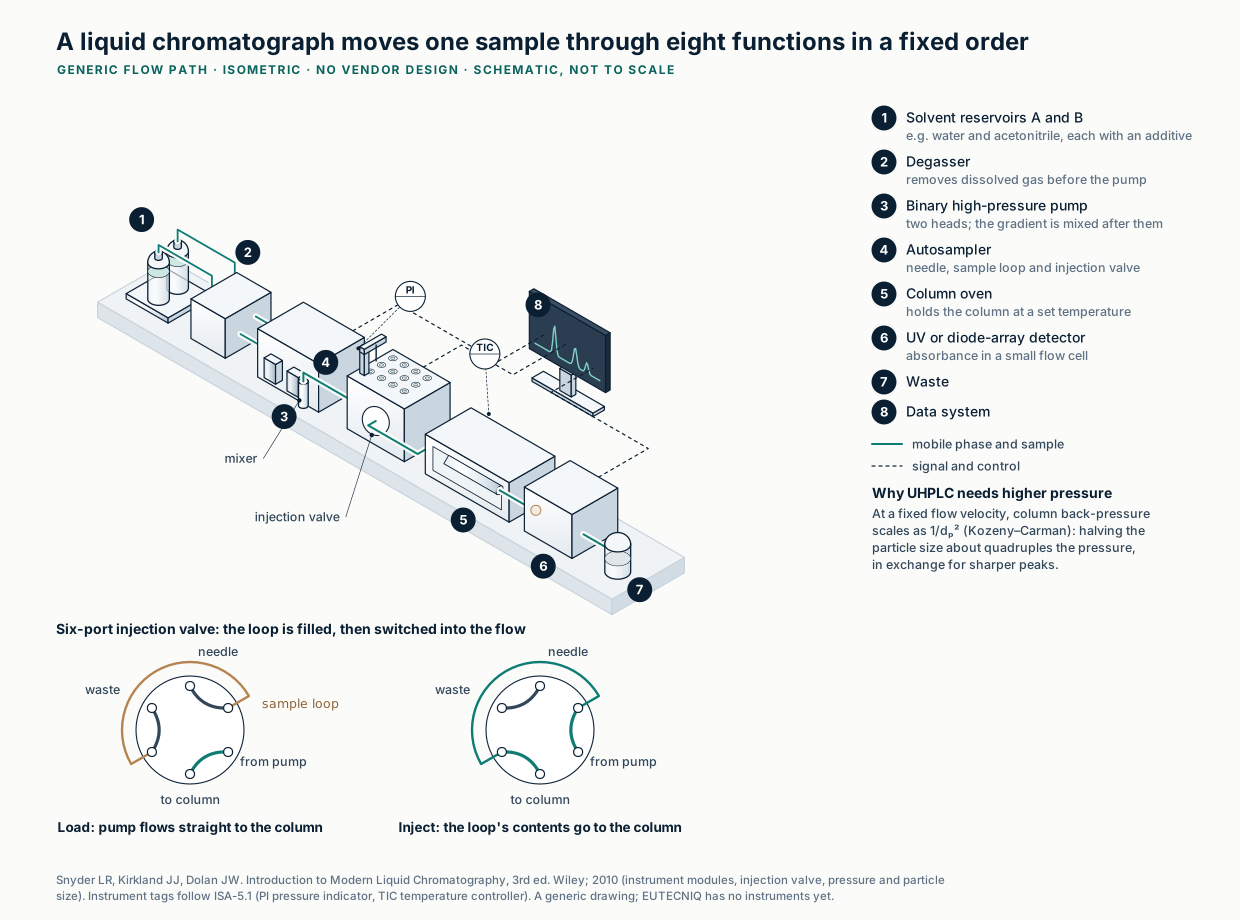
A pump drives the mobile phase through a packed column. Constituents partition between the mobile and stationary phases and leave the column at different times. The diode-array detector disperses light that has passed through the flow cell onto many photodiodes, so each point of the chromatogram carries a full UV-visible spectrum. UHPLC uses smaller packing particles at higher pressure for faster, sharper separations.
Key relationH = A + B/u + C·uVan Deemter: plate height H against mobile-phase velocity u, from eddy diffusion (A), longitudinal diffusion (B) and mass-transfer resistance (C).
Planned · Phase I
UV-Vis: a monochromator selects a wavelength and absorbance follows concentration along a calibration lineIllustrative schematic
USP ⟨857⟩ Ultraviolet-Visible Spectroscopy. Plotted traces are representative shapes, not measured data.
UV-visible spectrophotometry
What it measures, use, limits and standard
Measures
Absorbance at selected wavelengths; concentration through a calibration line.
Botanical use
Quantitating dissolution samples of single actives; spectrophotometric identification tests; colorimetric class assays.
Limits
No separation: everything that absorbs at the chosen wavelength adds up, so class assays are non-specific and are not identity tests. Linear only within a validated range.
Standard
USP ⟨857⟩ Ultraviolet-Visible Spectroscopy.
A grating selects a narrow band of wavelengths; the detector compares light transmitted through the sample with a blank. Absorbance is proportional to concentration and path length within the linear range.
Key relationA = ε · b · cBeer–Lambert law: absorbance A from molar absorptivity ε, path length b and concentration c.
Planned · phase not set
LC-MS/MS: the first quadrupole selects a precursor ion, a collision cell fragments it, and the third quadrupole passes one product ionIllustrative schematic
USP ⟨736⟩, ⟨561⟩; de Hoffmann E, Stroobant V. Mass Spectrometry: Principles and Applications. 3rd ed. Wiley; 2007; Eurofins, Multiresidue pesticides analysis (USP ⟨561⟩), accessed Oct 2026. Plotted traces are representative shapes, not measured data.
Triple-quadrupole LC-MS/MS
What it measures, use, limits and standard
Measures
Targeted compounds at trace levels: pesticide residues, mycotoxins, known adulterants and low-level markers.
Botanical use
Multiresidue pesticide panels; mycotoxin testing; screening for specific undeclared drugs or synthetic adulterants; trace marker quantitation.
Limits
It sees only what it is set to look for. Co-eluting matrix can suppress or enhance ionization, so calibration uses matrix-matched standards or isotope-labeled internal standards. Every analyte needs a reference standard.
Standard
USP ⟨736⟩ Mass Spectrometry; USP ⟨561⟩ Articles of Botanical Origin (pesticide residues).
After liquid chromatography and electrospray ionization, Q1 passes one precursor m/z, the collision cell fragments it, and Q3 passes one product m/z. Monitoring chosen precursor-to-product transitions (multiple reaction monitoring, MRM) gives high selectivity and sensitivity for named analytes.
Key relationprecursor m/z → product m/zEach MRM transition is a pair of masses; the ratio of two transitions of the same analyte is compared with a reference standard as a confirmation check.
Planned · Phase I
Contaminant methods
ICP-MS: an argon plasma atomizes and ionizes the digested sample; a helium collision cell removes polyatomic ions before the quadrupoleIllustrative schematic
Houk RS, et al. Anal Chem. 1980;52(14):2283–2289; USP ⟨233⟩, ⟨2232⟩; Agilent Technologies application note 5989-4905EN (2006), helium collision mode and kinetic energy discrimination. Plotted traces are representative shapes, not measured data.
Inductively coupled plasma mass spectrometry
What it measures, use, limits and standard
Measures
Trace elements, including arsenic, cadmium, lead and mercury, after acid digestion of the sample.
Botanical use
Elemental contaminants in botanicals, which can take up metals from soil.
Limits
Measures total element only: inorganic and organic arsenic need a separation step upstream. Digestion completeness and laboratory contamination control dominate accuracy.
A nebulized sample enters an argon plasma sustained by a radio-frequency coil, where it is atomized and ionized. Ions pass through sampler and skimmer cones into vacuum. In helium collision mode, larger polyatomic ions collide more often and lose more energy, and an energy barrier stops them (kinetic energy discrimination); the quadrupole then separates the remaining ions by m/z.
Key relation40Ar + 35Cl = 75 = 75AsWhy collision cells matter: the argon-chloride ion has the same nominal mass as arsenic.
Planned · Phase I
GC-MS: volatiles separate in a heated capillary column and are ionized at 70 eV before a quadrupole sorts them by m/zIllustrative schematic
USP ⟨561⟩; Eurofins, Multiresidue pesticides analysis (USP ⟨561⟩): most listed pesticides are analyzed by GC-MS/MS and LC-MS/MS (accessed Oct 2026); Shimadzu, GC-MS essential knowledge: ionization modes (accessed Oct 2026). Plotted traces are representative shapes, not measured data.
Gas chromatography–mass spectrometry
What it measures, use, limits and standard
Measures
Volatile and semi-volatile constituents such as essential-oil terpenes; with tandem mass spectrometry (GC-MS/MS), pesticide residues; confirmation of residual-solvent identity.
Botanical use
Essential-oil and aroma profiles; pesticide screening of raw materials; confirming peaks first found by headspace GC-FID.
Limits
Analytes must be volatile and thermally stable, or derivatized first. Glycosides and large polyphenols need liquid chromatography instead. A library match is a hypothesis until confirmed with a reference standard.
Vaporized compounds separate in a temperature-programmed capillary column by volatility and polarity. In the electron-ionization source, 70 eV electrons fragment each molecule into a reproducible pattern, and the quadrupole passes one m/z at a time to the detector. Static headspace sampling injects only the vapor above a heated sample.
Key relation70 eV electron ionizationSpectra recorded at the 70 eV standard can be searched against reference libraries recorded under the same conditions.
Planned · Phase I
HS-GC-FID: solvents leave a heated vial as vapor, separate in a capillary column and burn in a hydrogen flame that produces a measurable ion currentIllustrative schematic
USP ⟨467⟩; Thermo Fisher Scientific, Application Note 10676 (2018), static headspace for USP ⟨467⟩: procedures A, B and C. Peak positions in the figure are illustrative. Plotted traces are representative shapes, not measured data.
Headspace gas chromatography with flame ionization detection (HS-GC-FID)
What it measures, use, limits and standard
Measures
Residual solvents left by extraction, such as ethanol, methanol, acetone, ethyl acetate and hexane, and the ethanol content of liquid extracts.
Botanical use
Residual-solvent testing of extracts and powders; solvent recovery checks in the process.
Limits
The detector gives no structural information, so identity rests on retention time on two columns of different polarity or on GC-MS. Non-volatile residues are not seen.
Standard
USP ⟨467⟩ Residual Solvents (static-headspace GC procedures: A screening, B confirmation on a second column, C quantitation); USP ⟨621⟩ Chromatography.
Static headspace sampling injects only the vapor above a heated, sealed sample. The column separates the solvents; in the flame ionization detector, organic compounds burn in a hydrogen–air flame and form ions, and the collector current rises with the carbon reaching the flame.
Key relationidentity: retention time on two columnsQuantitation is by peak area against solvent standards.
Planned · phase not set
Solid-state and moisture methods
XRPD: crystal planes reflect X-rays only at angles that satisfy Bragg's law; an amorphous powder gives a broad halo insteadIllustrative schematic
Bragg WH, Bragg WL. Proc R Soc Lond A. 1913;88(605):428–438; Deutsch M, et al. J Res NIST. 2004;109(1):75–98 (Cu Kα₁ = 0.154 059 29 nm); USP ⟨941⟩. Plotted traces are representative shapes, not measured data.
X-ray powder diffraction
What it measures, use, limits and standard
Measures
Crystalline phases and the crystalline or amorphous state of powders.
Botanical use
Confirming that spray-dried or freeze-dried extracts and amorphous dispersions are amorphous, and detecting recrystallization during stability studies.
Limits
Low sensitivity to minor crystalline phases; says nothing about the chemical identity of amorphous material; preferred orientation alters peak intensities.
Standard
USP ⟨941⟩ Characterization of Crystalline and Partially Crystalline Solids by X-Ray Powder Diffraction (XRPD).
X-rays from a copper tube strike a flat powder sample while the detector moves around a goniometer circle. Constructive interference occurs when the path difference between planes equals a whole number of wavelengths, nλ = 2d·sinθ, giving a pattern of peaks characteristic of each crystal form.
Key relationn λ = 2 d sin θBragg's law; Cu Kα₁ radiation has λ = 1.5406 Å.
Partner laboratory
DSC and TGA: one measures heat flow and the other mass as the furnace temperature rises at a fixed rateIllustrative schematic
USP ⟨891⟩ Thermal Analysis. Plotted traces are representative shapes, not measured data.
Differential scanning calorimetry (DSC) and thermogravimetry (TGA)
What it measures, use, limits and standard
Measures
DSC: glass transitions, melting and crystallization. TGA: loss of moisture and solvent, and decomposition.
Botanical use
Glass-transition temperature of amorphous powders, which governs caking and storage stability; moisture and volatile content; excipient compatibility screening.
Limits
Thermal events overlap; milligram samples may not represent heterogeneous botanicals; interpretation needs complementary methods such as XRPD.
Standard
USP ⟨891⟩ Thermal Analysis.
In DSC the sample pan and an empty reference pan are heated together and the difference in heat flow is recorded. In TGA a microbalance weighs the sample continuously inside a furnace under purge gas.
Key relationT(t) = T₀ + β·tBoth methods scan temperature at a constant heating rate β.
Planned · phase not set
Water content, loss on drying and water activity
Measures
Total water (Karl Fischer), mass lost on heating (loss on drying) and the escaping tendency of water (water activity).
Principle, botanical use, limits and standard
Principle
Karl Fischer titration reacts water with iodine and sulfur dioxide; loss on drying weighs the sample before and after heating; a water-activity meter measures the equilibrium relative humidity above the sample in a sealed cell.
Botanical use
Specifications for powders and raw materials; stickiness and caking risk; microbial risk.
Limits
Loss on drying also counts volatile constituents and solvent. Water activity depends on temperature, so it is reported at a stated temperature.
Standard
USP ⟨921⟩ Water Determination; USP ⟨731⟩ Loss on Drying; USP ⟨922⟩ Water Activity. Related physics on the drying page.
Planned · phase not set
Particle and colloid methods
DLS: Brownian motion makes scattered light flicker; small droplets flicker faster, so the correlation function decays soonerIllustrative schematic
USP ⟨430⟩; ISO 22412:2025 (edition 3, which replaced the 2017 edition); LS Instruments, DLS theory (Siegert relation, Γ = Dq², Stokes–Einstein); HORIBA, dynamic light scattering technical page (scattering vector); Pátek J, et al. J Phys Chem Ref Data. 2009;38(1):21–29 (water viscosity). Plotted traces are representative shapes, not measured data.
Dynamic light scattering
What it measures, use, limits and standard
Measures
Hydrodynamic diameter and polydispersity of droplets and particles suspended in a liquid, in the nanometer to submicrometer range.
Botanical use
Droplet size of nanoemulsions and colloidal delivery systems during development and stability studies.
Limits
Intensity-weighted, so a few large particles or dust dominate. Poor for broad or multimodal samples. It measures size only, not stability, solubility or bioavailability.
Standard
USP ⟨430⟩ Particle Size Analysis by Dynamic Light Scattering; ISO 22412:2025 (edition 3, September 2025).
A laser illuminates the sample and a detector records the scattered intensity. A correlator computes the intensity autocorrelation g₂(τ); its decay rate Γ = Dq² gives the diffusion coefficient D, and the Stokes–Einstein relation converts D to size.
Key relationg₂ = 1 + β·e^(−2Γτ), Γ = D q², d = k_BT / (3π η D)q = (4πn/λ)·sin(θ/2). Curves at right are computed for water at 25 °C (η = 0.890 mPa·s), n = 1.33, λ = 633 nm, θ = 173° and β = 0.9; these settings are illustrative.
Planned · Phase I–II
Laser diffraction: large particles scatter light at small angles and small particles at wide angles; a ring detector records the patternIllustrative schematic
USP ⟨429⟩; ISO 13320:2020 Particle size analysis — Laser diffraction methods. Plotted traces are representative shapes, not measured data.
Laser diffraction
What it measures, use, limits and standard
Measures
Volume-weighted particle size distribution of powders, suspensions and emulsions, reported as D10, D50 and D90.
Assumes spherical particles; Mie results depend on the optical properties entered. The distribution is model-based, not a direct count.
Standard
USP ⟨429⟩ Light Diffraction Measurement of Particle Size; ISO 13320:2020.
A collimated laser passes through the dispersed sample. A Fourier lens maps each scattering angle onto a ring of the detector. The measured angular pattern is inverted with Mie theory, which needs the refractive indices of particle and medium, or with the Fraunhofer approximation.
Key relationD10 · D50 · D90Particle sizes below which 10%, 50% and 90% of the sample volume lies.
Planned · Phase I–II
Zeta potential (electrophoretic light scattering)
Measures
The electrokinetic potential of droplets or particles, a guide to electrostatic repulsion between them.
Principle, botanical use, limits and standard
Principle
An electric field moves charged droplets; the Doppler shift of scattered laser light gives their velocity, which is converted to zeta potential with a model for the double layer.
Botanical use
Screening emulsifiers, pH and salt for colloidal delivery systems.
Limits
Strongly dependent on pH, ionic strength and the conversion model. Steric stabilization is invisible to it. It predicts stability; it does not measure it.
Standard
No compendial chapter; reported with full measurement conditions. See the emulsions page.
Planned · phase not set
Performance tests
Dissolution: a standardized vessel, paddle and temperature turn product release into a comparable numberIllustrative schematic
USP ⟨711⟩ Dissolution (Apparatus 2 conditions); USP ⟨2040⟩. Plotted traces are representative shapes, not measured data.
Dissolution testing, Apparatus 2 (paddle)
What it measures, use, limits and standard
Measures
Rate and extent of release of a marker from a capsule or tablet into a defined medium.
Botanical use
Formulation development and lot-to-lot consistency of capsules and tablets, including dietary supplements.
Limits
In vitro release is not in vivo bioavailability. Botanical products contain many constituents of different solubility; lipid-based systems need digestion models (see Delivery).
Standard
USP ⟨711⟩ Dissolution; USP ⟨2040⟩ Disintegration and Dissolution of Dietary Supplements.
The dosage unit sinks to the bottom of the vessel; a paddle rotates at the speed specified in the monograph (within ±4%) with its blade 25 ± 2 mm above the vessel bottom, in medium held at 37 ± 0.5 °C. Samples are withdrawn at set times and analyzed by HPLC or UV-Vis.
Key relation37 ± 0.5 °C · 25 ± 2 mm · ±4%Apparatus 2 conditions from USP ⟨711⟩: medium temperature, blade height above the vessel bottom, rotation-speed tolerance.
Planned · phase not set
Franz cell: a topical formulation sits on skin or a membrane above a stirred receptor; permeation rises after a lag and then becomes steadyIllustrative schematic
Franz TJ. J Invest Dermatol. 1975;64:190–195; OECD TG 428 (2004); USP ⟨1724⟩; Crank J. The Mathematics of Diffusion. 2nd ed. 1975 (time-lag solution used for the curve). Plotted traces are representative shapes, not measured data.
Franz diffusion cell
What it measures, use, limits and standard
Measures
Release or permeation of an active from a topical formulation through a synthetic membrane or skin.
Botanical use
Development of topical and cosmetic delivery systems (see Delivery); comparing formulations.
Limits
In vitro only; membrane source and integrity drive variability. Penetration data alone do not establish safety, and claims about affecting the structure or function of the body make a product a drug.
Standard
OECD Test Guideline 428, Skin Absorption: In Vitro Method (2004); USP ⟨1724⟩ Semisolid Drug Products—Performance Tests.
The membrane separates a donor compartment from a stirred, temperature-controlled receptor chamber. Samples drawn from the side arm give cumulative amount permeated over time; the steady-state slope is the flux, and extrapolating it to the time axis gives the lag time.
Key relationJ = K_p · ΔC, t_lag = h² / 6DSteady-state flux J and the membrane time lag for thickness h and diffusivity D (Crank).
Planned · phase not set
Microbiological methods
Microbiological examination of supplements and botanicals
Measures
Total aerobic microbial count and total combined yeasts and molds; absence of specified organisms such as Escherichia coli, Salmonella and Staphylococcus aureus.
Principle, botanical use, limits and standard
Principle
Plate-count or most-probable-number methods enumerate microorganisms; enrichment and selective media test for specified organisms. Each method is first shown to recover organisms in the presence of the product, because some botanicals are antimicrobial.
Botanical use
Release testing of raw materials and products against microbial limits; environmental monitoring support.
Limits
Results take days of incubation. A count describes the sample tested, so sampling plans matter. Recommended limits are product-class guidance, not a substitute for a hazard analysis.
Standard
USP ⟨2021⟩ Microbial Enumeration Tests—Nutritional and Dietary Supplements; USP ⟨2022⟩ Microbiological Procedures for Absence of Specified Microorganisms—Nutritional and Dietary Supplements; USP ⟨2023⟩ Microbiological Attributes of Nonsterile Nutritional and Dietary Supplements.
Planned · Phase I
Explanation, details and sources
Schematics show real geometry and signal paths; plotted chromatograms, spectra and curves are illustrative shapes, not measured data and not EUTECNIQ results. Hover or tab to a component for a short description; each schematic's principle is also given in words below it. Unit operations that make material rather than measure it (supercritical CO₂ extraction, homogenizers, ultrafiltration, resin columns) are on the process engineering page.
A liquid chromatograph pumps, injects, separates, detects and records in a fixed order, and its injection valve switches a filled loop into the flowGeneric schematic
Snyder LR, Kirkland JJ, Dolan JW. Introduction to Modern Liquid Chromatography, 3rd ed. Wiley; 2010. Generated illustration, EUTECNIQ; no instrument brand or model implied. Full-size SVG
Discuss an analytical question
Partners with an identity, contaminant or method-validation problem can describe it; EUTECNIQ would propose a test plan, the laboratories that could run it and its limits.