

A dried powder stays stable only while it stays dry and glassy, and the dryer, carrier and package decide whether it does
How spray drying and freeze-drying make a powder, why powders take up water and cake, how packaging sets the clock, and how to read stability data.
Status. EUTECNIQ owns no dryer, laboratory or stability data. Laboratory drying is planned for Phase I and pilot spray, freeze and fluid-bed drying for Phase II (facility plan, October 2026).
Academy and related: carriers for spray-dried extracts (Course 12) · scale-up and tech transfer
Kashiwakura et al., J Appl Glycosci 2024; ICH Q1A(R2) and Q1E (2003), drug guidance; efficiency = (inlet − outlet)/(inlet − ambient), 20 °C ambient (Masters, Spray Drying Handbook).
A powder fails by taking up water, passing its glass transition or losing its active in the dryer, and each failure is measurable
Text version of the three failure routes
- Takes up water. Water crosses the package film and is absorbed along the sorption isotherm, so water activity rises. Controlled by the film's WVTR, the package area, the storage humidity and the powder's critical water activity. Measured as water content (Karl Fischer, USP ⟨921⟩), water activity (USP ⟨922⟩) and the sorption isotherm.
- Warms past its glass transition. Absorbed water lowers Tg; above Tg the amorphous glass becomes a sticky rubber that cakes, collapses or crystallizes. Controlled by a carrier that raises Tg, the dryer outlet temperature and the storage humidity and temperature. Measured by DSC (USP ⟨891⟩) and X-ray powder diffraction (USP ⟨941⟩).
- Loses its active in the dryer. Heat, oxygen and time degrade heat- or oxygen-sensitive constituents. Controlled by the drying route, inlet and outlet temperatures and inert gas. Measured by a validated assay before and after drying, on a dry-solids basis.
- Stability testing≠a validated shelf life
- Moisture content≠water activity
- Physical change (caking, collapse)≠chemical degradation of the active
- Accelerated-condition results≠long-term behavior, when storage crosses the glass transition
- Laboratory dryer feasibility≠commercial demonstration
Explanation, details and sources
- Choose route, carrier and conditions for a defined extract
- Measure moisture, water activity, Tg and crystallinity
- Match packaging to the critical water activity
- Design and interpret stability studies
- Run drying trials and tests before EUTECNIQ's laboratory exists
- Run specialist tests such as X-ray powder diffraction
- Supply commercial drying capacity
- Any dried product, yield or stability result
- A validated shelf life for any material
- That drying, by itself, improves absorption in people
Spray drying trades a short exposure to hot air for evaporative cooling; freeze-drying trades time and cost for cold
Hot air and spray enter together; by the bottom of the chamber the water has gone and powder flows to the cyclone
How it works
Pick an atomizer to see how it makes droplets. Hover or tab to any part for what it does.
Rotary disk. A disk spinning at high speed flings the feed off its rim, so the spray leaves almost sideways.
Text version of the energy balance, wall deposition and recovery
Streams per hour: ambient air, 2,089 kg dry air at 20 °C and 8 g water/kg, heated in H-101 to 180 °C; feed, 120 kg at 40% solids and 20 °C; exhaust air, 2,089 kg dry air at 85 °C carrying 41.5 g water/kg; powder, 50.0 kg at 4% moisture and 85 °C. Water evaporated: 70.0 kg/h. Heater duty 94.8 kW: evaporation 47.7 kW (50%), exhaust air 38.5 kW (41%), vapor superheat 2.4 kW, wall loss 4.7 kW, powder 1.5 kW. Thermal efficiency (Tin − Tout)/(Tin − T0) = 59%; 4.87 MJ per kg of water.
Wall deposition. Particles that touch the wall while above their glass transition stick there. Sugar-rich extracts are prone to this, because their glass-transition temperature is low (Bhandari et al. 1997). Deposits lower yield and stay exposed to hot air for longer. Carriers that raise the glass transition, and lower outlet temperatures, reduce deposition.
Powder recovery. Recovery is the powder collected divided by the solids fed. The difference is wall deposit, fines that escape the cyclone to the bag filter, and material lost at start-up and shutdown. Recovery is measured by a mass balance on each run, not assumed from the dryer's specification.
Data table: efficiency, %
| Inlet | 50 °C out | 70 °C out | 90 °C out | 110 °C out |
|---|
One droplet passes through five stages, and the shell that forms in the middle decides the particle's shape and density
How it works
Durations depend on droplet size, air temperature, humidity and feed solids, so no single time applies to every dryer.
Text version of the five stages
- AtomizationThe feed breaks into droplets; their size distribution sets everything that follows.
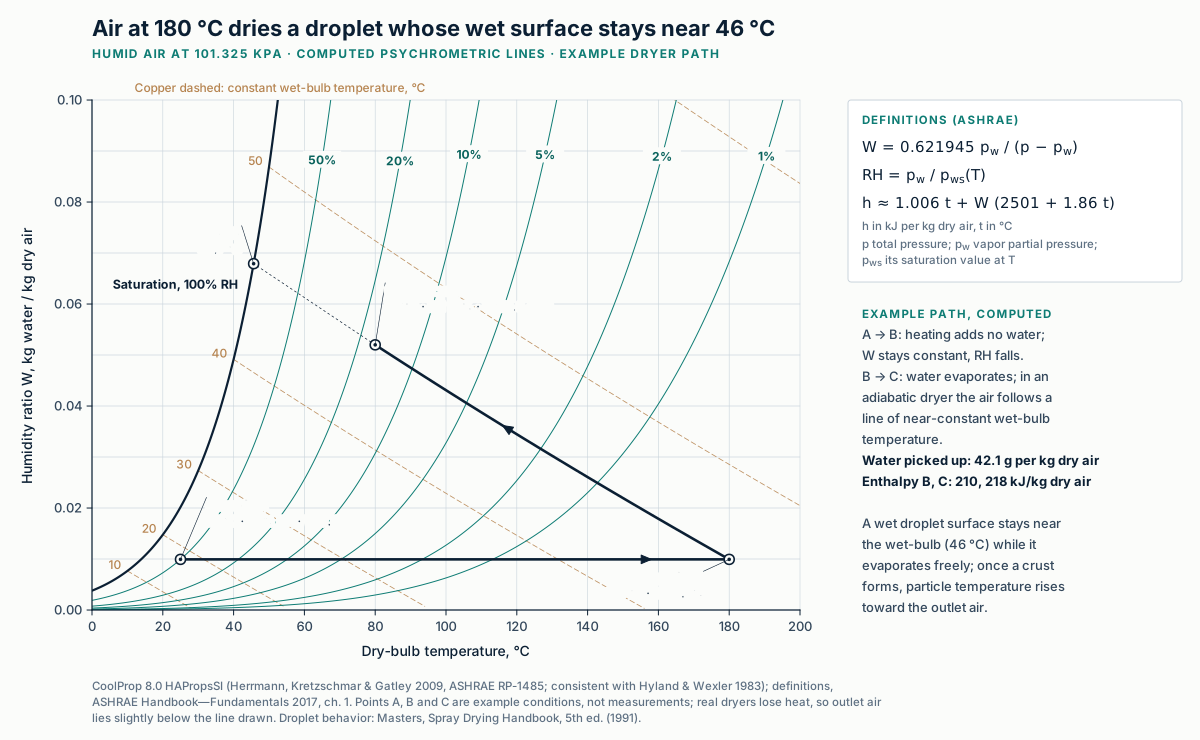
- First drying stageThe surface stays wet, the droplet sits near the wet-bulb temperature, and its area shrinks steadily.
- Skin formationDissolved solids crowd the receding surface; once they lock up, a shell or crust forms.
- Second drying stageWater must diffuse through the crust, so drying slows and the particle warms toward the outlet-air temperature.
- Separation and recoveryThe cyclone and bag filter collect powder; sticky particles deposit on the chamber wall instead.
Evaporation cools the droplet, so while it is still wet the product feels far less heat than the inlet air.
The Péclet number says whether a droplet dries into a dense bead or a hollow shell
How it works
If the surface recedes faster than dissolved molecules can diffuse inward, they pile up at the surface and form a shell early.
Pe = κ8 D D = kBT6πη r
Small molecules dried gently stay evenly spread and make dense particles; large molecules dried fast form a shell first.
Method, assumptions and limits
- What it calculates
- The first-stage drying time of one droplet, the diffusion coefficient of a dissolved molecule, the Péclet number and the surface enrichment of that solute.
- Equations
- τD = d0²/κ; D = kBT/(6πηr); Pe = κ/(8D); E = 1 + Pe/5 + Pe²/100 − Pe³/4000 (Vehring 2008, eq. 8).
- Variables and units
- d0 in µm; κ in µm²/ms (1 µm²/ms = 10⁻⁹ m²/s), on a logarithmic slider from 1 to 20; r in nm, logarithmic from 0.3 to 5; T = 298.15 K; η = 0.890 mPa·s. Pe is dimensionless: (m²/s)/(m²/s).
- Assumptions
- Constant evaporation rate; no interaction between solutes; diffusion coefficient of a sphere in water at 25 °C. A real drying droplet is warmer and more concentrated, so D is a first estimate.
- Valid range
- The enrichment formula is accurate to about ±1% for Pe below 20 (Vehring 2008); above that the readout says so instead of extrapolating.
- What it does not establish
- τD covers only the first drying stage, before the shell locks up; the second stage through the crust is slower. The model does not predict particle morphology for a real extract, which is checked by electron microscopy and density measurements.
- Verification
- Independent Python reference cases in
tests/numerics/ref/technologies-drying-particle-engineering.py.
A freeze-dryer is three things: cold shelves that hold the product, a colder condenser that traps vapor, and a vacuum pump
How it works
Hover or tab to any part for what it does.
The four steps of a freeze-drying cycle
- FreezeCool at normal pressure until all water is ice. Slow freezing grows bigger crystals, which sublime faster later.
- Pull vacuumDrop the pressure below the triple point, 611.657 Pa. Below it, liquid water cannot exist.
- Primary dryingWarm the shelves gently. Ice turns straight into vapor and freezes again on the condenser.
- Secondary dryingRaise the temperature to remove the bound water that never froze.
Freeze-drying works because ice can skip the liquid state entirely when the pressure is below the triple point.
Primary drying is a trade-off: a warmer product dries faster, until it crosses its collapse temperature
How it works
Sublimation is driven by the vapor pressure of ice at the product temperature minus the chamber pressure. Ten degrees warmer raises it 2.5 to 3.1 times between −45 and −10 °C (2.8 times from the default −32 °C). Above the collapse temperature the porous cake loses its structure.
Method, assumptions and limits
- What it calculates
- The vapor pressure of ice at the product temperature, the sublimation driving force against the chamber pressure, and the margin between product and collapse temperature.
- Equations
- ln pice = 9.550426 − 5723.265/T + 3.53068 ln T − 0.00728332 T (Murphy & Koop 2005, eq. 7; T in K, p in Pa); Δp = pice − pchamber.
- Variables and units
- Temperatures in °C on the sliders, converted to K; pressures in Pa.
- Assumptions
- Product temperature uniform at the sublimation front; practice cited by Bhatta et al. (2020): keep the product 2–3 °C below the collapse temperature, which can sit 2–20 °C above the glass transition of the freeze-concentrate. The flag turns amber within 2 °C of collapse.
- Valid range
- −45 to −10 °C and 2 to 30 Pa, inside the range of the Murphy–Koop equation (above 110 K).
- What it does not establish
- It does not compute sublimation rate, which also needs the dried-layer resistance and shelf heat transfer. Collapse temperatures are measured for each product, for example by freeze-drying microscopy. The cycle is illustrative, not a validated recipe.
- Verification
- Independent Python reference cases in
tests/numerics/ref/technologies-drying-particle-engineering.py.
Why it matters
In one published comparison, freeze-dried guava powder kept 63% of its vitamin C versus 25% in a heat-pump dryer, but freeze-drying is slow and costly (Bhatta et al. 2020), so the cycle has to be engineered rather than guessed. Related: freeze-drying calculator in the science lab.
What each route does to a botanical active: heat, oxygen and time
How it works
Emulsification devices, which make droplets rather than remove water, are compared on the emulsions page.
Text version of the comparison
A short exposure to hot air, but the droplet stays cool while it is wet
- Heat: the droplet sits near the wet-bulb temperature while water evaporates, then warms toward the outlet-air temperature
- Time: milliseconds to seconds for the first drying stage, depending on droplet size and air conditions
- Gas: air, or nitrogen in a closed cycle
- Watch: stickiness, wall deposits and shell formation
Cold and under vacuum, but slow
- Heat: product stays below its collapse temperature
- Time: hours to days; published plant-food runs took 18–48 h (guava: 24 h freezing, then 24 h drying)
- Oxygen: very low during drying
- Watch: cycle cost and collapse
Heat-sensitive actives point to freeze-drying or a carefully controlled spray dryer; oxygen-sensitive oils point to inert gas and to carriers that keep the powder glassy.
Water activity, not moisture content alone, decides when an amorphous powder turns sticky
W = WmCKaw /
[(1 − Kaw)(1 + (C − 1)Kaw)]
Published parameters for mango solids, maltodextrin and a 20 : 80 blend (Kashiwakura et al. 2024). Data, units and the measured-versus-computed critical water activities are in the methods panel.
Mango solids alone turn rubbery and sticky above about 8% relative humidity at 25 °C; blended 20 : 80 with maltodextrin they stay glassy up to about 40% in this model (34.5% measured).
Method, assumptions and limits
- What it calculates
- Equilibrium water content from the GAB isotherm at the chosen humidity, the glass-transition temperature of the wetted solid from the Gordon–Taylor equation, and the critical humidity at which Tg falls to 25 °C.
- Equations
- As shown above, with ws = 1/(1 + W/100) and ww = 1 − ws; the critical point is found by bisection.
- Variables and units
- W in g water per 100 g dry matter; Wm in the same units; C, K, k dimensionless; Tgs and Tgw in K, shown in °C.
- Assumptions
- Equilibrium at 25 °C; isotherm and Tg parameters exactly as tabulated by Kashiwakura et al. (2024, Table 1) for freeze-dried mango solids, maltodextrin and a 20 : 80 mango–maltodextrin blend (measurements by Fongin et al. 2017, 2019); Tgw = 136 K for water, as used by the authors. The glass-transition rule applies to any amorphous sugar-rich powder, spray-dried or freeze-dried. Relative humidity is the equilibrium water activity × 100; critical humidity is where Tg = 25 °C. The paper lists experimentally determined critical water activities of 0.074, 0.345 and 0.575; computed from its fitted parameters they are 0.076, 0.401 and 0.581, and the gap for the blend shows the uncertainty of chaining two fitted models.
- Valid range
- 2–70% relative humidity, inside the measured range of the source data.
- What it does not establish
- Caking also depends on time above Tg, particle size and pressure in the pack. The values describe mango-based powders, not any EUTECNIQ material.
- Verification
- The script in
src/modules/particles/compute/check_gt_gab.pyreproduces the tabulated critical water contents (1.9, 5.8 and 9.4 g per 100 g) and compares the computed critical water activities with the measured ones (0.076 versus 0.074, 0.401 versus 0.345, 0.581 versus 0.575). Reference cases intests/numerics/ref/technologies-drying-particle-engineering.py.
USP general chapters ⟨731⟩, ⟨891⟩, ⟨921⟩, ⟨922⟩ and ⟨941⟩ (USP–NF chapter list, accessed October 22, 2026). Water activity definition: FDA Inspection Technical Guide No. 39, Water Activity (aw) in Foods (1984). Roos Y, Karel M. Food Technol. 1991;45(12). Instrument principles are on the analytical page.
Academy: water activity and microbial growth limits (Course 7)
Explanation, details and sources
Moisture content is the mass of water in the powder. Water activity is its escaping tendency: the ratio of the powder's water vapor pressure to that of pure water at the same temperature (FDA Inspection Technical Guide 39). The sorption isotherm links the two; absorbed water lowers the glass-transition temperature (Tg).
Below Tg an amorphous powder is a hard glass; above it, a sticky rubber
Dried extracts are often amorphous, with no crystal lattice. Roos and Karel (1991) related Tg to stickiness, collapse and recrystallization.
Above Tg, amorphous sugars can crystallize
It changes structure, flow and solubility, and X-ray powder diffraction detects it. It is a physical change, possible with no chemical degradation.
A steeper sorption isotherm means more water taken up per step in humidity
In the published isotherms below, mango solids hold about 8.7 g of water per 100 g at 30% relative humidity, against about 4.9 g for maltodextrin.
Computed from published parameters| Property | What it tells you | How it is measured | Compendial chapter |
|---|---|---|---|
| Water content | Total water, the input to a mass balance and to dry-basis calculations | Karl Fischer titration | USP ⟨921⟩ Water Determination |
| Loss on drying | Mass lost on heating: water plus any other volatiles | Oven or balance drying under set conditions | USP ⟨731⟩ Loss on Drying |
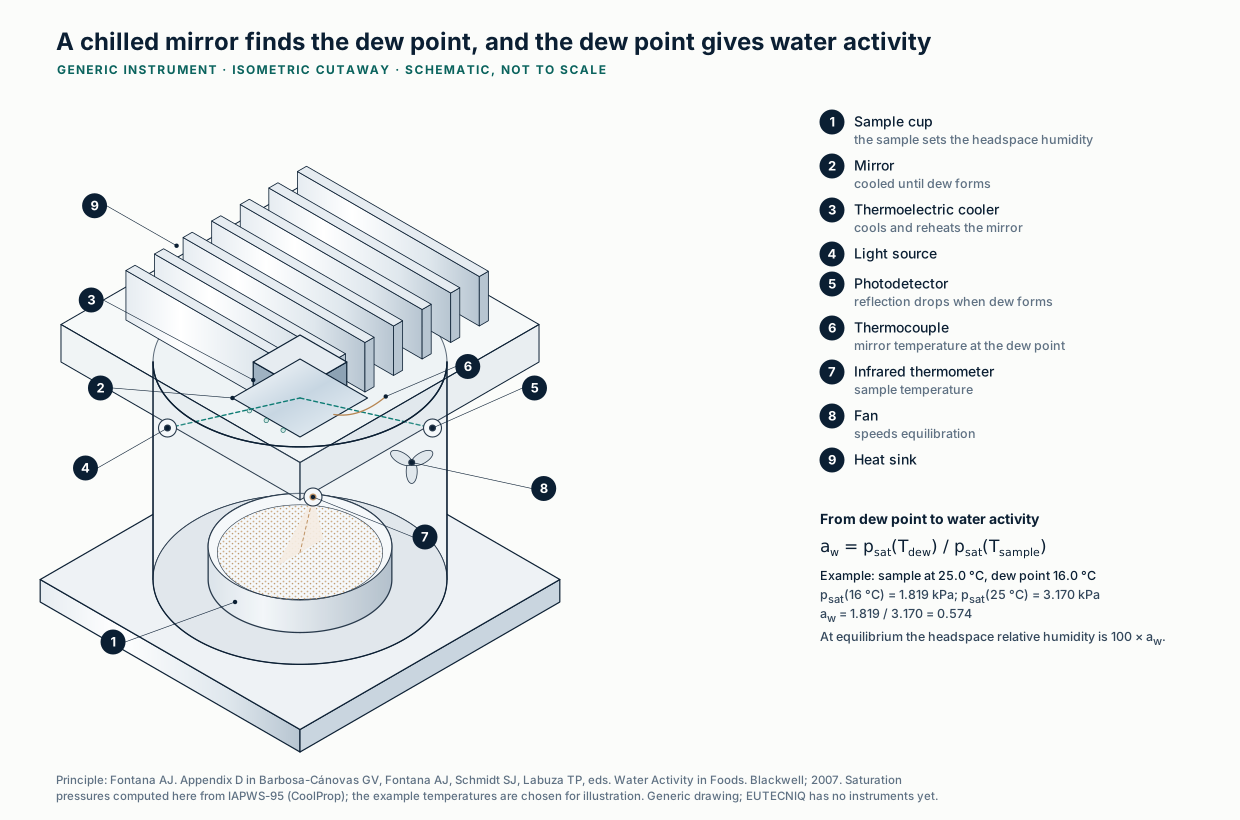
| Water activity | Escaping tendency of water; links to stickiness and microbial risk | Dew-point or capacitance sensor at controlled temperature | USP ⟨922⟩ Water Activity |
| Glass transition | Temperature at which the amorphous solid softens | Differential scanning calorimetry | USP ⟨891⟩ Thermal Analysis |
| Crystallinity | Whether the solid is amorphous or has crystallized | X-ray powder diffraction | USP ⟨941⟩ |
| Sorption isotherm | Water taken up at each humidity: hygroscopicity and critical water activity | Equilibration over controlled humidities or dynamic vapor sorption | Method-specific |
Packaging sets how fast a powder reaches its critical water activity, so the film is chosen from the powder's isotherm
= Π A psat(RH − aw)
Π = WVTR0.90 psat(38 °C)
Method, assumptions and limits
- What it calculates
- How the water activity inside a sealed package rises over time, and when it reaches the powder's critical water activity at 25 °C.
- Equations
- Film permeance Π = WVTR/(0.90 psat(38 °C)); flux J = ΠApsat(25 °C)(RH − aw); time to critical t = (mdry/100)/(ΠApsat) ∫ (dW/daw)/(RH − aw) daw, integrated with Simpson's rule from the packed to the critical water activity.
- Variables and units
- WVTR in g/(m²·day), on a logarithmic slider from 0.01 to 20; A in m²; mdry in g; psat in Pa (3,170 Pa at 25 °C, 6,630 Pa at 38 °C); W in g per 100 g dry. ΠAp has units g/day.
- Assumptions
- The critical water activity is computed from the fitted isotherm and Gordon–Taylor parameters (0.401 for the blend; 0.345 was measured), so the time to reach it carries that model uncertainty. The film's permeance at 25 °C equals that at the 38 °C test condition (real films differ, so a WVTR measured at storage conditions is preferred); the headspace is always in equilibrium with the powder; no leaks through seals; constant 25 °C outside humidity.
- Valid range
- Outside humidity 40–85%; packed water activity 0.02–0.30; inside the GAB parameter range of the source data.
- What it does not establish
- It ignores oxygen ingress, light, chemical degradation, temperature cycling and seal failure. It predicts a physical limit, not a shelf life; that comes from stability testing in the final package.
- Verification
- An independent Python solution in
tests/numerics/ref/technologies-drying-particle-engineering.pyintegrates the moisture balance in time (scipy) and is checked against the page.
Data table (percentage points of relative humidity)
| Powder (critical RH at 25 °C) | 25 °C/60% | 30 °C/65% | 40 °C/75% |
|---|---|---|---|
| Mango solids (7.4%) | +52.6 | +57.6 | +67.6 |
| Mango : maltodextrin 20 : 80 (34.5%) | +25.5 | +30.5 | +40.5 |
| Maltodextrin (57.5%) | +2.5 | +7.5 | +17.5 |
At 30 and 40 °C the critical humidity is lower than at 25 °C, so those cells understate the excess.
Explanation, details and sources
Water vapor crosses a package film at a rate set by its water vapor transmission rate (WVTR), its area and the humidity difference across it. The powder inside soaks up that water along its sorption isotherm until its glass transition falls to the storage temperature.
Stability data support a shelf life only while the lower confidence bound stays inside the specification, and only modestly beyond the data
Text version of the extrapolation limits
- Up to 2X, but not more than 12 months beyond X: no significant change at the accelerated condition, and either little or no change and variability, or data amenable to statistical analysis with the analysis performed (Q1E 2.4.1.1, 2.4.1.2).
- Up to 1.5X, but not more than 6 months beyond X: change or variability without statistical analysis (2.4.1.2); or significant change at the accelerated condition, no significant change at the intermediate condition, with statistical analysis (2.4.2.1).
- Up to 3 months beyond X: significant change at the accelerated condition, no significant change at the intermediate condition, data not amenable to statistical analysis (2.4.2.1).
- No extrapolation: significant change at the intermediate condition (2.4.2.2).
Each case also needs relevant supporting data. Refrigerated products have narrower limits (2.5).
LCB(t) = ŷ(t) − t0.95, n−2 s ×
√(1/n + (t − t̄)²/Stt)
Method, assumptions and limits
- What it calculates
- A least-squares line through illustrative assay results, its lower one-sided 95% confidence bound for the mean, the time at which that bound meets a 90% acceptance criterion, and the ICH Q1E cap on extrapolation.
- Equations
- As shown above. Stt = Σ(ti − t̄)²; s is the residual standard deviation with n − 2 degrees of freedom; cap = min(2tmax, tmax + 12 months). The supported period is the smaller of the crossing time and the cap, rounded down to whole months.
- Variables and units
- Assay in % of label claim; time in months; Student t quantiles 6.314, 2.920, 2.353, 2.132 and 2.015 for 1 to 5 degrees of freedom.
- Assumptions
- One batch, one result per pull point, starting at 101%; scatter = the chosen standard deviation times a fixed set of normal deviates; linear loss; the accelerated condition shows no significant change, so the twice-or-12-months rule applies.
- Valid range
- Loss rates 0.05–0.8% per month; scatter 0.2–2%; 6 to 24 months of data.
- What it does not establish
- A real program would test at least three batches (ICH Q1A(R2)) in the final package, check whether batches can be pooled (ICH Q1E), and track several attributes. For a multi-constituent botanical, the marker chosen may not represent the whole extract. Dietary supplements have no federal expiration-date requirement; FDA's Part 111 preamble says a firm that uses one should have data to support it.
- Verification
- Independent Python reference (numpy least squares, scipy Student t) in
tests/numerics/ref/technologies-drying-particle-engineering.py.
ICH Q1A(R2) Stability Testing of New Drug Substances and Products (Step 4, February 6, 2003); ICH Q1E (Step 4, February 6, 2003); FDA draft guidance Q1 Stability Testing of Drug Substances and Drug Products, June 24, 2025 (Docket FDA-2025-D-1106); ICH Q1 EWG work plan, February 2026. Part 111 preamble (72 FR 34752, June 25, 2007), as summarized by the Consumer Healthcare Products Association (2015).
Explanation, details and sources
ICH Q1E sets the drug-industry reference method: fit the trend, and take the earliest time at which the one-sided 95% confidence limit for the mean meets the acceptance criterion. Extrapolation is limited: up to twice the period covered by long-term data, and not more than 12 months beyond it, when accelerated data show no significant change and the data support statistical analysis.
40 °C and 75% RH can push an amorphous powder past its glass transition
A powder that cakes at 40/75 may never cake at 25/60. Extrapolating rates across a glass transition or any change of physical state is not valid; such results are a stress signal.
Engineering interpretationThree batches, in the package the customer receives
ICH Q1A(R2) asks for at least three primary batches, with long-term data at 25 °C/60% RH (or 30/65) and accelerated data at 40 °C/75% RH. Packaging is part of the system being tested.
Guidance (drug products)A consolidated ICH Q1 is still a draft
As of October 2026, the consolidated ICH Q1 guideline that would supersede Q1A–Q1F is a Step 2 draft (FDA draft guidance, June 2025); the ICH work plan targets Step 4 in November 2026. Q1A(R2) and Q1E remain the adopted texts.
DraftEvery model on this page makes a prediction that a measurement would confirm or reject
The models choose what to test first; none of them replaces the measurement.
Show the table (7 rows)
| Model prediction | Measurement that would confirm it | Typical acceptance logic |
|---|---|---|
| Particle shape from the Péclet number | Scanning electron microscopy; bulk and tapped density | Dense versus hollow or wrinkled particles as predicted |
| Critical water activity from Gordon–Taylor and GAB | DSC on samples equilibrated at several humidities; sorption isotherm | Measured Tg crosses 25 °C near the predicted humidity |
| Powder remains amorphous | X-ray powder diffraction at release and after storage | No new crystalline peaks |
| Residual moisture after drying | Karl Fischer water or loss on drying, with water activity | Inside the specification set from the isotherm |
| Active survives the dryer | Validated assay before and after drying, on a dry-solids basis | Retention inside a pre-set limit |
| Powder recovery | Mass balance on solids fed and powder collected, per run | Losses identified and trended |
| Package keeps the powder below critical | Film WVTR testing; water activity of packed samples during stability storage | Water activity stays below the critical value through the proposed period |
Discuss a powder or drying question
Partners with a sticky, unstable or hard-to-dry botanical extract can describe it; EUTECNIQ would respond with a proposed study plan and its limits.